Interpreting Line Plots in Grade 5 Math
Interactive Video
•
Mathematics
•
6th - 10th Grade
•
Practice Problem
•
Hard
+6
Standards-aligned

Sophia Harris
FREE Resource
Standards-aligned
Read more
10 questions
Show all answers
1.
MULTIPLE CHOICE QUESTION
30 sec • 1 pt
What is the primary purpose of using line plots?
To display data without repetition
To calculate complex equations
To create artistic representations
To display data with many repeating values
Tags
CCSS.3.MD.B.4
2.
MULTIPLE CHOICE QUESTION
30 sec • 1 pt
What does each 'X' above a number represent in a line plot?
A unique data value
A repeating data value
The frequency of a data value
The total of all data values
Tags
CCSS.3.MD.B.4
3.
MULTIPLE CHOICE QUESTION
30 sec • 1 pt
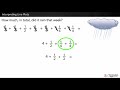
How many days had 1/4 inch of rain?
1 day
2 days
3 days
4 days
Tags
CCSS.2.MD.D.9
CCSS.3.MD.B.4
4.
MULTIPLE CHOICE QUESTION
30 sec • 1 pt
How many days had it rained 1 and 1/4 inches?
Three days
One day
Two days
Four days
Tags
CCSS.2.MD.D.9
CCSS.3.MD.B.4
5.
MULTIPLE CHOICE QUESTION
30 sec • 1 pt
How can 1/4 and 3/4 be combined?
To make 1/2
To make 2
To make 3/2
To make 1
Tags
CCSS.4.NF.B.3A
6.
MULTIPLE CHOICE QUESTION
30 sec • 1 pt
How many sets of 1/4 and 3/4 make a whole?
Four sets
Two sets
One set
Three sets
Tags
CCSS.4.NF.B.3A
7.
MULTIPLE CHOICE QUESTION
30 sec • 1 pt
What is the equivalent of 2/4?
1/4
1/2
1
3/4
Tags
CCSS.3.NF.A.3A
CCSS.3.NF.A.3B
CCSS.4.NF.A.1
Access all questions and much more by creating a free account
Create resources
Host any resource
Get auto-graded reports
Continue with Google

Continue with Email
Continue with Classlink
Continue with Clever
or continue with
Microsoft
%20(1).png)
Apple
Others
Already have an account?
