Exploring Adding and Subtracting Rational Expressions
Interactive Video
•
Mathematics
•
6th - 10th Grade
•
Practice Problem
•
Hard
+1
Standards-aligned

Emma Peterson
FREE Resource
Standards-aligned
10 questions
Show all answers
1.
MULTIPLE CHOICE QUESTION
30 sec • 1 pt
What is the purpose of a frequency table?
To display data in a pie chart
To group data into intervals and count the values within each
To calculate the mean of a dataset
To identify outliers in a dataset
2.
MULTIPLE CHOICE QUESTION
30 sec • 1 pt
What is crucial when creating intervals for a histogram?
Only the largest interval matters
They must not overlap and be of equal size
They can be of varying sizes
They must overlap slightly
Tags
CCSS.6.SP.B.4
CCSS.HSS.ID.A.1
3.
MULTIPLE CHOICE QUESTION
30 sec • 1 pt
What does the height of a bar in a histogram represent?
The median of the data
The frequency of data within an interval
The total number of data points
The mean of the data
Tags
CCSS.6.SP.B.4
CCSS.HSS.ID.A.1
4.
MULTIPLE CHOICE QUESTION
30 sec • 1 pt
Which interval contained the least amount of runners?
6 to 10 laps
11 to 15 laps
1 to 5 laps
16 to 20 laps
5.
MULTIPLE CHOICE QUESTION
30 sec • 1 pt
How do you determine the total number of runners from a histogram?
By counting the number of bars
By finding the average height of the bars
By multiplying the tallest bar by two
By adding the heights of the bars
Tags
CCSS.6.SP.B.5A
6.
MULTIPLE CHOICE QUESTION
30 sec • 1 pt
How many students weighed less than 8 pounds according to the histogram?
10 students
9 students
13 students
12 students
7.
MULTIPLE CHOICE QUESTION
30 sec • 1 pt
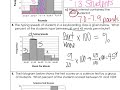
What percentage of students typed between 41 and 45 words per minute?
25%
45%
55%
75%
Tags
CCSS.HSF-BF.B.4A
Access all questions and much more by creating a free account
Create resources
Host any resource
Get auto-graded reports
Continue with Google

Continue with Email
Continue with Classlink
Continue with Clever
or continue with
Microsoft
%20(1).png)
Apple
Others
Already have an account?
