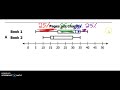
Exploring Box and Whisker Plots
Interactive Video
•
Mathematics
•
6th - 10th Grade
•
Practice Problem
•
Medium
Standards-aligned

Aiden Montgomery
Used 5+ times
FREE Resource
Standards-aligned
Read more
10 questions
Show all answers
1.
MULTIPLE CHOICE QUESTION
30 sec • 1 pt
What is the primary purpose of understanding the components of a box and whisker plot?
To solve complex algebraic equations
To understand the distribution of data
To calculate the area under the curve
To draw accurate pie charts
Tags
CCSS.6.SP.B.4
CCSS.HSS.ID.A.1
2.
MULTIPLE CHOICE QUESTION
30 sec • 1 pt
What does the lower quartile (Q1) represent in a box and whisker plot?
The middle value between the minimum and the median
The median of the dataset
The maximum value of the dataset
The average value of the dataset
Tags
CCSS.6.SP.B.4
CCSS.HSS.ID.A.1
3.
MULTIPLE CHOICE QUESTION
30 sec • 1 pt
What does the upper extreme (maximum) indicate in a box and whisker plot?
The average value of the dataset
The lowest value in the dataset
The highest value in the dataset
The median of the dataset
Tags
CCSS.6.SP.B.4
CCSS.HSS.ID.A.1
4.
MULTIPLE CHOICE QUESTION
30 sec • 1 pt
How is the range of a dataset calculated?
Maximum value minus minimum value
Maximum value divided by minimum value
Average of maximum and minimum values
Maximum value plus minimum value
Tags
CCSS.6.SP.B.4
CCSS.HSS.ID.A.1
5.
MULTIPLE CHOICE QUESTION
30 sec • 1 pt
What does the interquartile range (IQR) measure in a dataset?
The total spread of the data
The spread of the middle 50% of the data
The difference between the median and the mean
The average value of the data
Tags
CCSS.6.SP.B.5C
6.
MULTIPLE CHOICE QUESTION
30 sec • 1 pt
Each section of a box and whisker plot represents what percentage of the data?
25%
75%
10%
50%
Tags
CCSS.6.SP.B.4
CCSS.HSS.ID.A.1
7.
MULTIPLE CHOICE QUESTION
30 sec • 1 pt
What is the range of the data for intersection two, given the maximum is 650 and the minimum is 250?
200
400
450
500
Tags
CCSS.6.SP.B.4
CCSS.HSS.ID.A.1
Access all questions and much more by creating a free account
Create resources
Host any resource
Get auto-graded reports
Continue with Google

Continue with Email
Continue with Microsoft
or continue with

%20(1).png)
Apple
Others
Already have an account?
