Exploring Box and Whisker Plots
Interactive Video
•
Mathematics
•
6th - 10th Grade
•
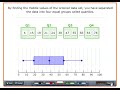
Practice Problem
•
Hard
+2
Standards-aligned

Amelia Wright
FREE Resource
Standards-aligned
10 questions
Show all answers
1.
MULTIPLE CHOICE QUESTION
30 sec • 1 pt
What is the primary purpose of a boxplot?
To calculate the mean of a dataset
To show the mode of a dataset
To summarize large amounts of data visually
To display the highest and lowest values in a dataset
Tags
CCSS.6.SP.B.4
CCSS.HSS.ID.A.1
2.
MULTIPLE CHOICE QUESTION
30 sec • 1 pt
What is the first step in creating a boxplot?
Identifying the quartiles
Drawing the box
Ordering the data from least to greatest
Finding the median of the dataset
Tags
CCSS.6.SP.B.4
CCSS.HSS.ID.A.1
3.
MULTIPLE CHOICE QUESTION
30 sec • 1 pt
How is the median of a dataset identified in a boxplot?
It's the average of all values
It's the middle value after ordering the data
It's the difference between the highest and lowest values
It's the value that appears most frequently
Tags
CCSS.6.SP.B.4
CCSS.HSS.ID.A.1
4.
MULTIPLE CHOICE QUESTION
30 sec • 1 pt
What does the median represent in a boxplot?
The middle value of the dataset
The lowest value in the dataset
The average value of the dataset
The highest value in the dataset
Tags
CCSS.6.SP.B.5C
5.
MULTIPLE CHOICE QUESTION
30 sec • 1 pt
What does a shorter distance between points in a quartile indicate?
The median is very high
There is a large variance in the data
The data is spread out
The data is closely bunched together
Tags
CCSS.6.SP.B.4
CCSS.HSS.ID.A.1
6.
MULTIPLE CHOICE QUESTION
30 sec • 1 pt
How are the lower and upper extremes determined in a boxplot?
They are the most frequently occurring values
They are the first and last items in an ordered set of data
They are the average values of the dataset
They are the median values of the dataset
Tags
CCSS.6.SP.B.4
CCSS.HSS.ID.A.1
7.
MULTIPLE CHOICE QUESTION
30 sec • 1 pt
Which ski resort shows a higher median annual snowfall according to the boxplot?
The data is inconclusive
Both have the same median
Mad Mountain
Powder Valley
Tags
CCSS.6.SP.B.4
CCSS.HSS.ID.A.1
Access all questions and much more by creating a free account
Create resources
Host any resource
Get auto-graded reports
Continue with Google

Continue with Email
Continue with Classlink
Continue with Clever
or continue with
Microsoft
%20(1).png)
Apple
Others
Already have an account?
