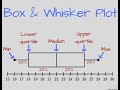
Exploring Box Plots
Interactive Video
•
Mathematics
•
6th - 10th Grade
•
Practice Problem
•
Hard
Standards-aligned

Lucas Foster
Used 1+ times
FREE Resource
Standards-aligned
10 questions
Show all answers
1.
MULTIPLE CHOICE QUESTION
30 sec • 1 pt
What is the purpose of a box plot?
To compare two different datasets
To display the distribution of data based on a five-number summary
To show the mean value of a dataset
To plot individual data points on a graph
Tags
CCSS.6.SP.B.4
CCSS.HSS.ID.A.1
2.
MULTIPLE CHOICE QUESTION
30 sec • 1 pt
What does the median represent in a box plot?
The highest value of the dataset
The middle value of the dataset
The average value of the dataset
The lowest value of the dataset
Tags
CCSS.6.SP.B.4
CCSS.HSS.ID.A.1
3.
MULTIPLE CHOICE QUESTION
30 sec • 1 pt
How is the lower quartile (Q1) determined in a box plot?
It is the difference between the maximum and minimum values
It is the median of the data from the median to the minimum
It is the average of all the data points
It is the median of the data from the median to the maximum
Tags
CCSS.6.SP.B.4
CCSS.HSS.ID.A.1
4.
MULTIPLE CHOICE QUESTION
30 sec • 1 pt
What is the interquartile range (IQR) in a box plot?
The sum of Q1 and Q3
The difference between Q3 and Q1
The difference between the median and the minimum value
The range of the entire dataset
Tags
CCSS.6.SP.B.4
CCSS.HSS.ID.A.1
5.
MULTIPLE CHOICE QUESTION
30 sec • 1 pt
When creating a box plot, what is the first step?
Calculating the interquartile range
Drawing the box
Identifying the median
Arranging the data in ascending order
Tags
CCSS.6.SP.B.4
CCSS.HSS.ID.A.1
6.
MULTIPLE CHOICE QUESTION
30 sec • 1 pt
What does the dot represent in a box plot?
The quartiles of the dataset
The maximum or minimum value of the dataset
The mean of the dataset
The median of the dataset
Tags
CCSS.6.SP.B.4
CCSS.HSS.ID.A.1
7.
MULTIPLE CHOICE QUESTION
30 sec • 1 pt
How do you find the median in a dataset with an even number of values?
By adding all values and dividing by the number of values
By choosing the value in the middle
By averaging the two middlemost numbers
By subtracting the smallest value from the largest
Tags
CCSS.6.SP.B.5C
Access all questions and much more by creating a free account
Create resources
Host any resource
Get auto-graded reports
Continue with Google

Continue with Email
Continue with Microsoft
or continue with

%20(1).png)
Apple
Others
Already have an account?
