- Resource Library
- Math
- Probability And Statistics
- Two Way Frequency Tables
- Exploring Two Way Frequency Tables In Statistics
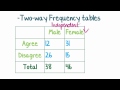
Exploring Two-way Frequency Tables in Statistics
Interactive Video
•
Mathematics
•
6th - 10th Grade
•
Practice Problem
•
Hard
Standards-aligned

Ethan Morris
Used 6+ times
FREE Resource
Standards-aligned
Read more
10 questions
Show all answers
1.
MULTIPLE CHOICE QUESTION
30 sec • 1 pt
Which plot is used to compare a categorical and a numerical dataset?
Two-way frequency table
Back-to-back stem plot
Scatterplot
Percentage segmented bar chart
2.
MULTIPLE CHOICE QUESTION
30 sec • 1 pt
How do you represent data when you have more than two categories in your categorical variable?
Two-way frequency table
Parallel box plot with multiple boxes
Back-to-back stem plot
Scatterplot
3.
MULTIPLE CHOICE QUESTION
30 sec • 1 pt
What is used to represent two categorical variables?
Parallel box plot
Two-way frequency table
Scatterplot
Back-to-back stem plot
4.
MULTIPLE CHOICE QUESTION
30 sec • 1 pt
Which chart is used to represent percentages of categories?
Percentage segmented bar chart
Parallel box plot
Two-way frequency table
Scatterplot
5.
MULTIPLE CHOICE QUESTION
30 sec • 1 pt
What type of plot is recommended for two numerical variables?
Percentage segmented bar chart
Scatterplot
Two-way frequency table
Parallel box plot
6.
MULTIPLE CHOICE QUESTION
30 sec • 1 pt
In a two-way frequency table, what does each cell represent?
The sum of two numerical variables
The intersection count of two categorical variables
A percentage of one variable over another
A total count of variables
Tags
CCSS.8.SP.A.4
7.
MULTIPLE CHOICE QUESTION
30 sec • 1 pt
How do you calculate percentages in a two-way frequency table?
Divide the cell count by the total count of its row
Divide the cell count by the total count of its column
Divide the cell count by the total count of all cells
Divide the row total by the column total
Tags
CCSS.8.SP.A.4
Access all questions and much more by creating a free account
Create resources
Host any resource
Get auto-graded reports
Continue with Google

Continue with Email
Continue with Microsoft
or continue with

%20(1).png)
Apple
Others
Already have an account?
