Exploring Scatter Plots with Explain Everything
Interactive Video
•
Mathematics
•
6th - 10th Grade
•
Practice Problem
•
Hard
+4
Standards-aligned

Sophia Harris
FREE Resource
Standards-aligned
10 questions
Show all answers
1.
MULTIPLE CHOICE QUESTION
30 sec • 1 pt
What is a scatter plot used to show?
The sum of two datasets
The difference between two variables
The relationship between two sets of data
The division of data into categories
Tags
CCSS.8.SP.A.1
2.
MULTIPLE CHOICE QUESTION
30 sec • 1 pt
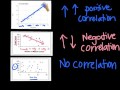
What does a positive correlation in a scatter plot indicate?
As one variable decreases, the other increases
As one variable increases, the other decreases
There is no relationship between the variables
As one variable increases, so does the other
Tags
CCSS.HSS.ID.B.5
3.
MULTIPLE CHOICE QUESTION
30 sec • 1 pt
What is an example of a negative correlation?
More time on Twitter leading to lower test scores
More study time leading to higher test scores
Shoe size and IQ score
Age and number of siblings
Tags
CCSS.HSS.ID.B.5
4.
MULTIPLE CHOICE QUESTION
30 sec • 1 pt
What does 'no correlation' mean in scatter plots?
One variable increases as the other decreases
There is no discernible pattern between the datasets
Data points are close to each other
The data points form a straight line
Tags
CCSS.HSA.REI.D.12
5.
MULTIPLE CHOICE QUESTION
30 sec • 1 pt
What is another term for correlation in scatter plots?
Divergence
Convergence
Association
Disparity
Tags
CCSS.HSS.ID.B.5
6.
MULTIPLE CHOICE QUESTION
30 sec • 1 pt
How can you describe the direction of a scatter plot?
By the size of the data points
Whether the data points trend upwards or downwards
By the shape of the data points
By the color of the data points
Tags
CCSS.8.F.B.4
CCSS.HSF.LE.A.2
7.
MULTIPLE CHOICE QUESTION
30 sec • 1 pt
What does a strong association in a scatter plot indicate?
Data points form a circular pattern
There is no line of best fit
Data points closely follow the line of best fit
Data points are widely spread from the line of best fit
Tags
CCSS.8.EE.B.5
Access all questions and much more by creating a free account
Create resources
Host any resource
Get auto-graded reports
Continue with Google

Continue with Email
Continue with Classlink
Continue with Clever
or continue with
Microsoft
%20(1).png)
Apple
Others
Already have an account?
Popular Resources on Wayground

15 questions
Fractions on a Number Line
Quiz
•
3rd Grade
10 questions
Probability Practice
Quiz
•
4th Grade
15 questions
Probability on Number LIne
Quiz
•
4th Grade
20 questions
Equivalent Fractions
Quiz
•
3rd Grade
25 questions
Multiplication Facts
Quiz
•
5th Grade
22 questions
fractions
Quiz
•
3rd Grade
6 questions
Appropriate Chromebook Usage
Lesson
•
7th Grade
10 questions
Greek Bases tele and phon
Quiz
•
6th - 8th Grade
Discover more resources for Mathematics
20 questions
Writing Algebraic Expressions
Quiz
•
6th Grade
20 questions
Ratios/Rates and Unit Rates
Quiz
•
6th Grade
14 questions
Volume of rectangular prisms
Quiz
•
7th Grade
23 questions
TSI Math Vocabulary
Quiz
•
10th - 12th Grade
15 questions
Graphing Inequalities
Quiz
•
7th - 9th Grade
20 questions
Graphing Inequalities on a Number Line
Quiz
•
6th - 9th Grade
20 questions
One Step Equations
Quiz
•
6th Grade
12 questions
One-Step Equations
Quiz
•
6th Grade