8th Grade Math STAAR Test Review Insights
Interactive Video
•
Mathematics
•
6th - 10th Grade
•
Practice Problem
•
Medium
+4
Standards-aligned

Lucas Foster
Used 1+ times
FREE Resource
Standards-aligned
Read more
10 questions
Show all answers
1.
MULTIPLE CHOICE QUESTION
30 sec • 1 pt
Which of the following numbers is the smallest?
6.1666
-5.2
-5.1717
5.7445
Tags
CCSS.6.NS.C.7A
CCSS.6.NS.C.7B
2.
MULTIPLE CHOICE QUESTION
30 sec • 1 pt
What is the value of root 33 to four decimal places?
6.2831
0.34
3.1415
5.7445
Tags
CCSS.8.EE.A.2
3.
MULTIPLE CHOICE QUESTION
30 sec • 1 pt
Which value is NOT located between 1 and 6.2831 on the number line?
1.09
0.34
3
3.1415
Tags
CCSS.6.NS.C.7A
CCSS.6.NS.C.7B
4.
MULTIPLE CHOICE QUESTION
30 sec • 1 pt
Which of the following is a correct representation of a direct variation?
y = 2x
y = x + 2
y = 1/x
y = x^2
5.
MULTIPLE CHOICE QUESTION
30 sec • 1 pt
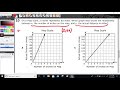
On a map scale, if 2 inches represent 60 miles, which graph correctly shows this relationship?
Graph A
Graph B
Graph C
Graph D
Tags
CCSS.8.EE.B.5
6.
MULTIPLE CHOICE QUESTION
30 sec • 1 pt
If 2 inches on a map represent 60 miles, how many miles would 5 inches represent?
75 miles
150 miles
120 miles
300 miles
Tags
CCSS.6.RP.A.3B
7.
MULTIPLE CHOICE QUESTION
30 sec • 1 pt
If a hot air balloon rises at a constant rate, which table correctly shows the relationship between time and height?
Table D
Table A
Table B
Table C
Tags
CCSS.HSF-LE.A.1B
Access all questions and much more by creating a free account
Create resources
Host any resource
Get auto-graded reports
Continue with Google

Continue with Email
Continue with Classlink
Continue with Clever
or continue with
Microsoft
%20(1).png)
Apple
Others
Already have an account?
