Exploring Line Plots in 2nd Grade Math
Interactive Video
•
Mathematics
•
6th - 10th Grade
•
Practice Problem
•
Medium
+6
Standards-aligned

Olivia Brooks
Used 4+ times
FREE Resource
Standards-aligned
Read more
10 questions
Show all answers
1.
MULTIPLE CHOICE QUESTION
30 sec • 1 pt
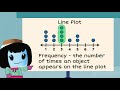
What does 'frequency' in data representation mean?
The complexity of the data
The average value of the data set
The number of times an object appears
The total sum of all data points
Tags
CCSS.6.SP.B.5A
2.
MULTIPLE CHOICE QUESTION
30 sec • 1 pt
What does the data in a line plot represent?
Predictions for future data
Objects being recorded
Historical data only
Hypotheses being tested
Tags
CCSS.3.MD.B.4
3.
MULTIPLE CHOICE QUESTION
30 sec • 1 pt
How many students did not lose any pencils according to the line plot?
Four
One
Two
Three
Tags
CCSS.2.MD.D.9
CCSS.3.MD.B.4
4.
MULTIPLE CHOICE QUESTION
30 sec • 1 pt
What does a dot above a number in a line plot represent?
The minimum value recorded
A student or instance counted
The maximum value recorded
The total number of objects
Tags
CCSS.2.MD.D.9
5.
MULTIPLE CHOICE QUESTION
30 sec • 1 pt
What is the first step in creating a line plot?
Creating a title for the plot
Listing all possible scores
Drawing dots for each data point
Drawing the line
Tags
CCSS.3.MD.B.4
6.
MULTIPLE CHOICE QUESTION
30 sec • 1 pt
How many students scored 27 on the math assignment?
Four
Five
Eight
Two
Tags
CCSS.5.G.A.2
7.
MULTIPLE CHOICE QUESTION
30 sec • 1 pt
How many students scored a perfect score in the math assignment?
One
Two
Three
Four
Tags
CCSS.2.MD.D.9
Access all questions and much more by creating a free account
Create resources
Host any resource
Get auto-graded reports
Continue with Google

Continue with Email
Continue with Classlink
Continue with Clever
or continue with
Microsoft
%20(1).png)
Apple
Others
Already have an account?
Popular Resources on Wayground

8 questions
Spartan Way - Classroom Responsible
Quiz
•
9th - 12th Grade
15 questions
Fractions on a Number Line
Quiz
•
3rd Grade
14 questions
Boundaries & Healthy Relationships
Lesson
•
6th - 8th Grade
20 questions
Equivalent Fractions
Quiz
•
3rd Grade
3 questions
Integrity and Your Health
Lesson
•
6th - 8th Grade
25 questions
Multiplication Facts
Quiz
•
5th Grade
9 questions
FOREST Perception
Lesson
•
KG
20 questions
Main Idea and Details
Quiz
•
5th Grade
Discover more resources for Mathematics
12 questions
Review: Surface Area of Rectangular and Triangular Prisms
Quiz
•
6th Grade
20 questions
Scatter Plots and Line of Best Fit
Quiz
•
8th Grade
36 questions
6th Grade Math STAAR Review
Quiz
•
6th Grade
12 questions
8th U6 L4 - Fitting a Line to Data
Quiz
•
8th Grade
14 questions
Volume of rectangular prisms
Quiz
•
7th Grade
25 questions
Scatter Plots and Line of Best Fit
Quiz
•
8th Grade
14 questions
finding slope from a graph
Quiz
•
8th Grade
20 questions
Graphing Inequalities on a Number Line
Quiz
•
6th - 9th Grade