Exploring Bar Graphs, Dot Plots, and Pictographs
Interactive Video
•
Mathematics
•
6th - 10th Grade
•
Practice Problem
•
Hard
+3
Standards-aligned

Sophia Harris
FREE Resource
Standards-aligned
10 questions
Show all answers
1.
MULTIPLE CHOICE QUESTION
30 sec • 1 pt
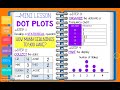
What is a dot plot used to represent in statistical data?
Data predictions
Percentage of data
Frequency of data points
Categories of data
Tags
CCSS.6.SP.B.4
CCSS.HSS.ID.A.1
2.
MULTIPLE CHOICE QUESTION
30 sec • 1 pt
What is the first step in creating a statistical display?
Collecting data
Drawing the display
Developing a statistical question
Organizing data into a frequency chart
Tags
CCSS.2.MD.D.10
3.
MULTIPLE CHOICE QUESTION
30 sec • 1 pt
How are tally marks used in organizing data for a dot plot?
To represent categories
To indicate frequency
To show data predictions
To denote percentages
Tags
CCSS.6.SP.B.4
CCSS.HSS.ID.A.1
4.
MULTIPLE CHOICE QUESTION
30 sec • 1 pt
Which statistical display would be most suitable for showing the distribution of a single numerical variable?
Pictograph
Bar graph
Dot plot
Line graph
5.
MULTIPLE CHOICE QUESTION
30 sec • 1 pt
What does a bar graph's vertical axis represent?
Predictions
Data samples
Frequency
Categories
Tags
CCSS.2.MD.D.10
6.
MULTIPLE CHOICE QUESTION
30 sec • 1 pt
In a bar graph about hiking preferences, what does the highest bar represent?
Location with the most facilities
Average preference
Most preferred location
Least preferred location
Tags
CCSS.2.MD.D.10
7.
MULTIPLE CHOICE QUESTION
30 sec • 1 pt
What statistical question was asked to create the bar graph?
Favorite school subject
Preferred hiking location
Number of siblings
Favorite type of pizza
Tags
CCSS.6.SP.A.1
Access all questions and much more by creating a free account
Create resources
Host any resource
Get auto-graded reports
Continue with Google

Continue with Email
Continue with Classlink
Continue with Clever
or continue with
Microsoft
%20(1).png)
Apple
Others
Already have an account?
