Interpreting Line Plots Effectively
Interactive Video
•
Mathematics
•
6th - 10th Grade
•
Practice Problem
•
Hard
+11
Standards-aligned

Lucas Foster
FREE Resource
Standards-aligned
Read more
10 questions
Show all answers
1.
MULTIPLE CHOICE QUESTION
30 sec • 1 pt
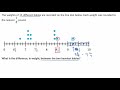
How many babies' weights were recorded?
9
12
11
10
Tags
CCSS.2.MD.D.9
2.
MULTIPLE CHOICE QUESTION
30 sec • 1 pt
To what precision were the babies' weights rounded?
Nearest 1/2 pound
Nearest pound
Nearest 1/8 pound
Nearest 1/4 pound
Tags
CCSS.5.NF.A.1
CCSS.5.NF.A.2
3.
MULTIPLE CHOICE QUESTION
30 sec • 1 pt
What was the weight of the heaviest baby?
8 and 3/4 pounds
9 and 1/4 pounds
9 pounds
9 and 1/2 pounds
Tags
CCSS.6.NS.C.7A
CCSS.6.NS.C.7B
4.
MULTIPLE CHOICE QUESTION
30 sec • 1 pt
How was the weight of the heaviest baby represented?
9 and 2/8 pounds
9 pounds
9 and 3/8 pounds
9 and 1/2 pounds
Tags
CCSS.4.MD.B.4
5.
MULTIPLE CHOICE QUESTION
30 sec • 1 pt
What fraction is equivalent to 2/8, as used in the video?
1/3
3/4
1/2
1/4
Tags
CCSS.3.NF.A.3A
CCSS.3.NF.A.3B
CCSS.4.NF.A.1
6.
MULTIPLE CHOICE QUESTION
30 sec • 1 pt
Which of the following is not a correct representation of the heaviest baby's weight?
9 and 1/4 pounds
9 and 1/2 pounds
Both 9 and 2/8 pounds and 9 and 1/4 pounds are correct
9 and 2/8 pounds
Tags
CCSS.4.NF.A.2
7.
MULTIPLE CHOICE QUESTION
30 sec • 1 pt
What was the weight of the second heaviest baby?
8 and 1/2 pounds
8 and 3/4 pounds
8 and 1/4 pounds
8 pounds
Tags
CCSS.4.NF.A.2
Access all questions and much more by creating a free account
Create resources
Host any resource
Get auto-graded reports
Continue with Google

Continue with Email
Continue with Microsoft
or continue with

%20(1).png)
Apple
Others
Already have an account?
