Exploring Line Plots in 3rd Grade Math
Interactive Video
•
Mathematics
•
6th - 10th Grade
•
Practice Problem
•
Hard
+2
Standards-aligned

Mia Campbell
FREE Resource
Standards-aligned
Read more
10 questions
Show all answers
1.
MULTIPLE CHOICE QUESTION
30 sec • 1 pt
How many chairs are there in total if there are 5 rows with 5 chairs in each row?
15
20
10
25
Tags
CCSS.1.NBT.A.1
2.
MULTIPLE CHOICE QUESTION
30 sec • 1 pt
What is the total number of pencils in a pencil box with 4 rows and 4 pencils in each row?
12
8
16
20
Tags
CCSS.2.OA.C.4
3.
MULTIPLE CHOICE QUESTION
30 sec • 1 pt
If a patio has 8 rows of bricks with 8 bricks in each row, how many bricks are there in total?
64
72
56
48
Tags
CCSS.3.OA.A.3
4.
MULTIPLE CHOICE QUESTION
30 sec • 1 pt
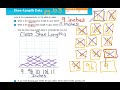
What is the shortest shoe length recorded in the data?
9 inches
9.5 inches
10 inches
10.5 inches
Tags
CCSS.3.MD.B.4
5.
MULTIPLE CHOICE QUESTION
30 sec • 1 pt
How many students had shoe lengths of 9 inches?
4
2
1
3
Tags
CCSS.2.MD.D.9
6.
MULTIPLE CHOICE QUESTION
30 sec • 1 pt
What shoe size should be bought the most based on the class data?
9 and 9.5 inches
10 and 10.5 inches
11 inches only
9.5 and 10 inches
Tags
CCSS.2.MD.D.9
7.
MULTIPLE CHOICE QUESTION
30 sec • 1 pt
How many students are in the fourth grade class according to the line plot?
18
25
15
20
Tags
CCSS.2.MD.D.9
CCSS.3.MD.B.4
Create a free account and access millions of resources
Create resources
Host any resource
Get auto-graded reports
Continue with Google

Continue with Email
Continue with Classlink
Continue with Clever
or continue with
Microsoft
%20(1).png)
Apple
Others
Already have an account?
Popular Resources on Wayground

5 questions
This is not a...winter edition (Drawing game)
Quiz
•
1st - 5th Grade
25 questions
Multiplication Facts
Quiz
•
5th Grade
10 questions
Identify Iconic Christmas Movie Scenes
Interactive video
•
6th - 10th Grade
20 questions
Christmas Trivia
Quiz
•
6th - 8th Grade
18 questions
Kids Christmas Trivia
Quiz
•
KG - 5th Grade
11 questions
How well do you know your Christmas Characters?
Lesson
•
3rd Grade
14 questions
Christmas Trivia
Quiz
•
5th Grade
20 questions
How the Grinch Stole Christmas
Quiz
•
5th Grade
Discover more resources for Mathematics
10 questions
Identify Iconic Christmas Movie Scenes
Interactive video
•
6th - 10th Grade
15 questions
Solving Equations with Variables on Both Sides Review
Quiz
•
8th Grade
21 questions
Convert Fractions, Decimals, and Percents
Quiz
•
6th Grade
20 questions
Solving Systems of Equations by Graphing
Quiz
•
8th Grade
20 questions
Exponents
Quiz
•
6th Grade
15 questions
Christmas Movie Trivia
Quiz
•
7th Grade
25 questions
Christmas Trivia
Quiz
•
8th Grade
20 questions
Scatter Plots and Line of Best Fit
Quiz
•
8th Grade