Graph Interpretation and Analysis
Interactive Video
•
Mathematics, Science
•
6th - 8th Grade
•
Practice Problem
•
Easy

Mia Campbell
Used 1+ times
FREE Resource
Read more
10 questions
Show all answers
1.
MULTIPLE CHOICE QUESTION
30 sec • 1 pt
What is a qualitative graph primarily used for?
To represent numerical data precisely
To display statistical analysis
To show relationships between two variables without numerical data
To calculate exact values
2.
MULTIPLE CHOICE QUESTION
30 sec • 1 pt
In the bathtub example, what happens to the water level when you relax in the tub?
It decreases
It fluctuates
It increases
It remains constant
3.
MULTIPLE CHOICE QUESTION
30 sec • 1 pt
During the restaurant example, what happens when most people leave at the same time?
The number of people increases slowly
The number of people decreases quickly
The number of people remains constant
The number of people fluctuates
4.
MULTIPLE CHOICE QUESTION
30 sec • 1 pt
In Charlie's journey, what does a constant section of the graph indicate?
Charlie is moving quickly
Charlie is waiting or stopped
Charlie is accelerating
Charlie is decelerating
5.
MULTIPLE CHOICE QUESTION
30 sec • 1 pt
What is the greatest increase in hot dogs sold between which two days?
Day 3 and Day 4
Day 8 and Day 9
Day 1 and Day 2
Day 6 and Day 7
6.
MULTIPLE CHOICE QUESTION
30 sec • 1 pt
What does a horizontal line in the hot dog sales graph represent?
An increase in sales
A decrease in sales
Constant sales
Fluctuating sales
7.
MULTIPLE CHOICE QUESTION
30 sec • 1 pt
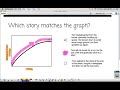
In the story matching section, what does a graph with a slow increase followed by a faster increase represent?
Tom walking, then running faster
Tom gradually speeding up
Tom walking slowly, then stopping
Tom running quickly, then slowing down
Access all questions and much more by creating a free account
Create resources
Host any resource
Get auto-graded reports
Continue with Google

Continue with Email
Continue with Classlink
Continue with Clever
or continue with
Microsoft
%20(1).png)
Apple
Others
Already have an account?
Popular Resources on Wayground

15 questions
Fractions on a Number Line
Quiz
•
3rd Grade
20 questions
Equivalent Fractions
Quiz
•
3rd Grade
25 questions
Multiplication Facts
Quiz
•
5th Grade
22 questions
fractions
Quiz
•
3rd Grade
20 questions
Main Idea and Details
Quiz
•
5th Grade
20 questions
Context Clues
Quiz
•
6th Grade
15 questions
Equivalent Fractions
Quiz
•
4th Grade
20 questions
Figurative Language Review
Quiz
•
6th Grade
Discover more resources for Mathematics
20 questions
Exponents
Quiz
•
6th Grade
22 questions
distributive property
Quiz
•
7th Grade
15 questions
Distributive Property & Review
Quiz
•
6th Grade
20 questions
Writing Algebraic Expressions
Quiz
•
6th Grade
20 questions
Ratios/Rates and Unit Rates
Quiz
•
6th Grade
20 questions
Writing and Graphing Inequalities
Quiz
•
6th Grade
15 questions
Product of Powers Property A1 U7
Quiz
•
8th Grade
20 questions
Laws of Exponents
Quiz
•
8th Grade