Understanding Data Representation
Interactive Video
•
Mathematics, Education
•
3rd - 6th Grade
•
Practice Problem
•
Hard

Liam Anderson
FREE Resource
Read more
10 questions
Show all answers
1.
MULTIPLE CHOICE QUESTION
30 sec • 1 pt
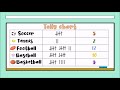
What was the favorite sport of the majority of students in the story?
Soccer
Basketball
Football
Tennis
2.
MULTIPLE CHOICE QUESTION
30 sec • 1 pt
How many students chose tennis as their favorite sport?
5
2
9
12
3.
MULTIPLE CHOICE QUESTION
30 sec • 1 pt
What is the purpose of using tally marks in data organization?
To confuse the reader
To make data look neat
To add artistic value
To easily count and organize data
4.
MULTIPLE CHOICE QUESTION
30 sec • 1 pt
In a tally chart, what does a diagonal line across four vertical lines represent?
5
10
15
20
5.
MULTIPLE CHOICE QUESTION
30 sec • 1 pt
Which sport had the least number of students choosing it as their favorite?
Tennis
Soccer
Baseball
Football
6.
MULTIPLE CHOICE QUESTION
30 sec • 1 pt
What is the main advantage of using a bar chart?
It provides a visual comparison of data
It is easier to draw
It uses less space
It is colorful
7.
MULTIPLE CHOICE QUESTION
30 sec • 1 pt
How many students chose basketball as their favorite sport?
10
9
12
5
Access all questions and much more by creating a free account
Create resources
Host any resource
Get auto-graded reports
Continue with Google

Continue with Email
Continue with Classlink
Continue with Clever
or continue with
Microsoft
%20(1).png)
Apple
Others
Already have an account?
Popular Resources on Wayground

15 questions
Fractions on a Number Line
Quiz
•
3rd Grade
20 questions
Equivalent Fractions
Quiz
•
3rd Grade
25 questions
Multiplication Facts
Quiz
•
5th Grade
54 questions
Analyzing Line Graphs & Tables
Quiz
•
4th Grade
22 questions
fractions
Quiz
•
3rd Grade
20 questions
Main Idea and Details
Quiz
•
5th Grade
20 questions
Context Clues
Quiz
•
6th Grade
15 questions
Equivalent Fractions
Quiz
•
4th Grade
Discover more resources for Mathematics
15 questions
Fractions on a Number Line
Quiz
•
3rd Grade
20 questions
Equivalent Fractions
Quiz
•
3rd Grade
25 questions
Multiplication Facts
Quiz
•
5th Grade
54 questions
Analyzing Line Graphs & Tables
Quiz
•
4th Grade
22 questions
fractions
Quiz
•
3rd Grade
15 questions
Equivalent Fractions
Quiz
•
4th Grade
18 questions
Comparing Fractions with same numerator or denominator
Quiz
•
3rd Grade
16 questions
Interpreting Line Graphs & Double Tables
Quiz
•
4th Grade