Analyzing Data Distributions and Measures
Interactive Video
•
Mathematics, Science
•
5th - 8th Grade
•
Practice Problem
•
Hard

Ethan Morris
FREE Resource
Read more
10 questions
Show all answers
1.
MULTIPLE CHOICE QUESTION
30 sec • 1 pt
What is the first step in creating a stem-and-leaf plot?
Count the total number of data points.
Label the stem and leaf sections.
Identify the smallest and largest numbers.
Calculate the mean of the data.
2.
MULTIPLE CHOICE QUESTION
30 sec • 1 pt
How many numbers should be placed on the stem for a three-digit number?
Four numbers
One number
Three numbers
Two numbers
3.
MULTIPLE CHOICE QUESTION
30 sec • 1 pt
What is the range of the data set if the highest number is 151 and the lowest is 111?
60
30
40
50
4.
MULTIPLE CHOICE QUESTION
30 sec • 1 pt
How do you find the median in a data set with an even number of values?
Average the two middle numbers.
Choose the lowest number.
Select the middle number.
Choose the highest number.
5.
MULTIPLE CHOICE QUESTION
30 sec • 1 pt
Which numbers appear most frequently in the data set?
142, 149, 150
111, 118, 123
148, 149, 151
130, 135, 136
6.
MULTIPLE CHOICE QUESTION
30 sec • 1 pt
What is the purpose of creating a frequency distribution table?
To calculate the mean of the data.
To visualize the distribution of data.
To find the median of the data.
To list all data points in order.
7.
MULTIPLE CHOICE QUESTION
30 sec • 1 pt
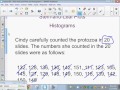
How many slides contained between 120 and 149 protozoa?
10
12
15
18
Access all questions and much more by creating a free account
Create resources
Host any resource
Get auto-graded reports
Continue with Google

Continue with Email
Continue with Classlink
Continue with Clever
or continue with
Microsoft
%20(1).png)
Apple
Others
Already have an account?
Popular Resources on Wayground

7 questions
History of Valentine's Day
Interactive video
•
4th Grade
15 questions
Fractions on a Number Line
Quiz
•
3rd Grade
20 questions
Equivalent Fractions
Quiz
•
3rd Grade
25 questions
Multiplication Facts
Quiz
•
5th Grade
22 questions
fractions
Quiz
•
3rd Grade
15 questions
Valentine's Day Trivia
Quiz
•
3rd Grade
20 questions
Main Idea and Details
Quiz
•
5th Grade
20 questions
Context Clues
Quiz
•
6th Grade
Discover more resources for Mathematics
25 questions
Multiplication Facts
Quiz
•
5th Grade
20 questions
Classifying Triangles
Quiz
•
5th Grade
10 questions
Multiplying Fractions
Quiz
•
5th Grade
20 questions
Writing Algebraic Expressions
Quiz
•
6th Grade
10 questions
Adding and Subtracting Decimals
Quiz
•
5th Grade
20 questions
Ratios/Rates and Unit Rates
Quiz
•
6th Grade
15 questions
Rounding Decimals
Quiz
•
5th Grade
14 questions
Volume of rectangular prisms
Quiz
•
7th Grade