Understanding Box and Whisker Plots
Interactive Video
•
Mathematics
•
6th - 8th Grade
•
Practice Problem
•
Medium
Standards-aligned

Olivia Brooks
Used 22+ times
FREE Resource
Standards-aligned
Read more
10 questions
Show all answers
1.
MULTIPLE CHOICE QUESTION
30 sec • 1 pt
What is the primary purpose of using box and whisker plots?
To find the standard deviation of a dataset
To determine the mode of a dataset
To provide a visual summary of a dataset
To calculate the mean of a dataset
Tags
CCSS.6.SP.B.4
CCSS.HSS.ID.A.1
2.
MULTIPLE CHOICE QUESTION
30 sec • 1 pt
In a box and whisker plot, what does the minimum value represent?
The smallest value in the dataset
The most frequent value in the dataset
The average of the dataset
The range of the dataset
Tags
CCSS.6.SP.B.4
CCSS.HSS.ID.A.1
3.
MULTIPLE CHOICE QUESTION
30 sec • 1 pt
What is the interquartile range (IQR) in a box and whisker plot?
The sum of all quartiles
The difference between the third quartile and the first quartile
The length of the whiskers
The difference between the maximum and minimum values
Tags
CCSS.6.SP.A.2
4.
MULTIPLE CHOICE QUESTION
30 sec • 1 pt
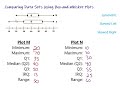
How does dataset N differ from dataset M in terms of spread?
Dataset N is more concentrated
Dataset N is more spread out
Dataset N has a smaller range
Dataset N has a larger median
Tags
CCSS.6.SP.B.4
CCSS.HSS.ID.A.1
5.
MULTIPLE CHOICE QUESTION
30 sec • 1 pt
What percentage of data is contained within each quartile of a box and whisker plot?
25%
10%
50%
75%
Tags
CCSS.6.SP.B.4
CCSS.HSS.ID.A.1
6.
MULTIPLE CHOICE QUESTION
30 sec • 1 pt
Which percentile does the median of a box and whisker plot represent?
50th percentile
25th percentile
75th percentile
100th percentile
7.
MULTIPLE CHOICE QUESTION
30 sec • 1 pt
What does it mean if a box and whisker plot is symmetric?
The data has no outliers
The data is evenly distributed around the median
The data is skewed to the left
The data is skewed to the right
Access all questions and much more by creating a free account
Create resources
Host any resource
Get auto-graded reports
Continue with Google

Continue with Email
Continue with Microsoft
or continue with

%20(1).png)
Apple
Others
Already have an account?
