Sampling and Data Analysis Concepts
Interactive Video
•
Mathematics, Science, Education
•
9th - 12th Grade
•
Practice Problem
•
Medium

Jackson Turner
Used 18+ times
FREE Resource
Read more
10 questions
Show all answers
1.
MULTIPLE CHOICE QUESTION
30 sec • 1 pt
What is the main difference between qualitative and quantitative variables?
Both qualitative and quantitative variables are numerical.
Qualitative variables are numerical, while quantitative variables are descriptive.
Both qualitative and quantitative variables are descriptive.
Qualitative variables are descriptive, while quantitative variables are numerical.
2.
MULTIPLE CHOICE QUESTION
30 sec • 1 pt
Which type of data is described by whole numbers?
Qualitative data
Continuous data
Sample data
Discrete data
3.
MULTIPLE CHOICE QUESTION
30 sec • 1 pt
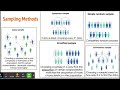
What is the primary characteristic of simple random sampling?
It uses a systematic approach to select samples.
It ensures proportional representation of characteristics.
It selects samples based on convenience.
It involves random selection without any order.
4.
MULTIPLE CHOICE QUESTION
30 sec • 1 pt
In stratified sampling, how are samples chosen?
Randomly without any order
By selecting every nth individual
Based on convenience
To match the proportion of certain characteristics in the population
5.
MULTIPLE CHOICE QUESTION
30 sec • 1 pt
Which measure of central tendency is most affected by outliers?
Mean
Median
All are equally affected
Mode
6.
MULTIPLE CHOICE QUESTION
30 sec • 1 pt
When is the median a more appropriate measure than the mean?
When data has no outliers
When data is normally distributed
When data is qualitative
When data has extreme values
7.
MULTIPLE CHOICE QUESTION
30 sec • 1 pt
What is the first step in calculating the mean using a calculator?
Determine the range
Find the mode
Calculate the standard deviation
Enter the data into the list
Access all questions and much more by creating a free account
Create resources
Host any resource
Get auto-graded reports
Continue with Google

Continue with Email
Continue with Classlink
Continue with Clever
or continue with
Microsoft
%20(1).png)
Apple
Others
Already have an account?
