Understanding Bar Graphs and Histograms
Interactive Video
•
Mathematics, Science
•
5th - 8th Grade
•
Practice Problem
•
Easy

Sophia Harris
Used 1+ times
FREE Resource
Read more
10 questions
Show all answers
1.
MULTIPLE CHOICE QUESTION
30 sec • 1 pt
What is the primary focus of statistics in mathematics?
Solving equations
Understanding chemical reactions
Studying shapes and angles
Collecting, organizing, and analyzing data
2.
MULTIPLE CHOICE QUESTION
30 sec • 1 pt
How do histograms differ visually from bar graphs?
Histograms have spaces between bars
Histograms are circular
Histograms have no spaces between bars
Histograms use different colors for each bar
3.
MULTIPLE CHOICE QUESTION
30 sec • 1 pt
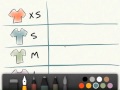
In the t-shirt size example, what determines the size of the t-shirt?
The color of the t-shirt
The age of the person
The height interval of the person
The weight of the person
4.
MULTIPLE CHOICE QUESTION
30 sec • 1 pt
Why is it important to have no overlaps in histogram intervals?
To make the histogram colorful
To ensure the bars are wider
To make the histogram taller
To avoid confusion about which category a data point belongs to
5.
MULTIPLE CHOICE QUESTION
30 sec • 1 pt
What is the purpose of using a frequency table before creating a histogram?
To add colors to the bars
To organize data for easy conversion to a histogram
To make the bars taller
To create a pie chart
6.
MULTIPLE CHOICE QUESTION
30 sec • 1 pt
What is a key characteristic of intervals in a histogram?
They must be the same for each bar
They must be different for each bar
They must be in alphabetical order
They must overlap
7.
MULTIPLE CHOICE QUESTION
30 sec • 1 pt
What is the main advantage of using a histogram for data visualization?
It requires less data
It is easier to draw than a bar graph
It provides an easy visual reference for comparing data
It uses bright colors
Access all questions and much more by creating a free account
Create resources
Host any resource
Get auto-graded reports
Continue with Google

Continue with Email
Continue with Microsoft
or continue with

%20(1).png)
Apple
Others
Already have an account?
