- Resource Library
- Math
- Probability And Statistics
- Frequency Tables
- Understanding Histograms And Frequency Tables
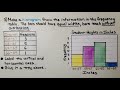
Understanding Histograms and Frequency Tables
Interactive Video
•
Mathematics
•
6th - 7th Grade
•
Practice Problem
•
Easy

Thomas White
Used 1+ times
FREE Resource
Read more
10 questions
Show all answers
1.
MULTIPLE CHOICE QUESTION
30 sec • 1 pt
What is the primary purpose of a histogram?
To compare two different data sets
To display data in a pie chart format
To show the frequency of data within equal intervals
To list data items in alphabetical order
2.
MULTIPLE CHOICE QUESTION
30 sec • 1 pt
What is an interval in the context of a histogram?
The average of all data points
The total number of data points
The space between marked values on a number line
The space between two data points
3.
MULTIPLE CHOICE QUESTION
30 sec • 1 pt
How do you determine the height of the bars in a histogram?
By the average value of the data set
By the total number of data points
By the frequency of data within each interval
By the number of intervals
4.
MULTIPLE CHOICE QUESTION
30 sec • 1 pt
What happens to a histogram if three new students of a certain height range join the class?
The bars become wider
The histogram remains unchanged
A new interval is added
The bar for that height range increases in height
5.
MULTIPLE CHOICE QUESTION
30 sec • 1 pt
How are frequency tables and histograms similar?
Both require a title
Both show data in alphabetical order
Both display data in a pie chart
Both use the same intervals
6.
MULTIPLE CHOICE QUESTION
30 sec • 1 pt
What is the effect of adding a student with a height outside the current intervals in a histogram?
The intervals are rearranged
The existing bars increase in height
A new bar with a new interval is added
The histogram remains unchanged
7.
MULTIPLE CHOICE QUESTION
30 sec • 1 pt
What does a frequency table show that a histogram does not?
The total number of data points
The distribution of data
The average value of the data set
The frequency as a number in a column
Access all questions and much more by creating a free account
Create resources
Host any resource
Get auto-graded reports
Continue with Google

Continue with Email
Continue with Microsoft
or continue with

%20(1).png)
Apple
Others
Already have an account?
