Understanding Frequency Charts
Interactive Video
•
Mathematics, Science, Education
•
5th - 8th Grade
•
Practice Problem
•
Hard

Emma Peterson
FREE Resource
Read more
9 questions
Show all answers
1.
MULTIPLE CHOICE QUESTION
30 sec • 1 pt
What is the primary purpose of a frequency chart?
To summarize data by showing how often each value occurs
To display data in a pie chart format
To calculate the average of data values
To list data values in alphabetical order
2.
MULTIPLE CHOICE QUESTION
30 sec • 1 pt
What are the two columns in a frequency chart?
Data values and their percentages
Data values and their averages
Data values and their sums
Data values and their frequencies
3.
MULTIPLE CHOICE QUESTION
30 sec • 1 pt
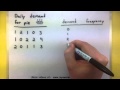
In the pie demand example, what was the demand on day two?
One pie
Three pies
No pies
Two pies
4.
MULTIPLE CHOICE QUESTION
30 sec • 1 pt
When creating a frequency chart, how should data values be listed?
From largest to smallest
In random order
From smallest to largest
In alphabetical order
5.
MULTIPLE CHOICE QUESTION
30 sec • 1 pt
How many times did the demand for zero pies occur?
Four times
Once
Twice
Three times
6.
MULTIPLE CHOICE QUESTION
30 sec • 1 pt
What is the first step in creating a frequency chart?
Calculate the average of data values
List data values from smallest to largest
Draw a pie chart
List data values in alphabetical order
7.
MULTIPLE CHOICE QUESTION
30 sec • 1 pt
What does the frequency column in a frequency chart represent?
The percentage of each data value
The number of times each data value appears
The average of data values
The sum of data values
Access all questions and much more by creating a free account
Create resources
Host any resource
Get auto-graded reports
Continue with Google

Continue with Email
Continue with Classlink
Continue with Clever
or continue with
Microsoft
%20(1).png)
Apple
Others
Already have an account?
Similar Resources on Wayground
Popular Resources on Wayground

15 questions
Fractions on a Number Line
Quiz
•
3rd Grade
10 questions
Probability Practice
Quiz
•
4th Grade
15 questions
Probability on Number LIne
Quiz
•
4th Grade
20 questions
Equivalent Fractions
Quiz
•
3rd Grade
25 questions
Multiplication Facts
Quiz
•
5th Grade
22 questions
fractions
Quiz
•
3rd Grade
6 questions
Appropriate Chromebook Usage
Lesson
•
7th Grade
10 questions
Greek Bases tele and phon
Quiz
•
6th - 8th Grade
Discover more resources for Mathematics
25 questions
Multiplication Facts
Quiz
•
5th Grade
10 questions
Multiplying Fractions
Quiz
•
5th Grade
20 questions
Writing Algebraic Expressions
Quiz
•
6th Grade
10 questions
Adding and Subtracting Decimals
Quiz
•
5th Grade
20 questions
Ratios/Rates and Unit Rates
Quiz
•
6th Grade
15 questions
Rounding Decimals
Quiz
•
5th Grade
14 questions
Volume of rectangular prisms
Quiz
•
7th Grade
15 questions
Graphing Inequalities
Quiz
•
7th - 9th Grade