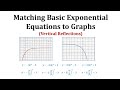
Graph Transformations and Asymptotes
Interactive Video
•
Mathematics
•
9th - 12th Grade
•
Practice Problem
•
Hard
+1
Standards-aligned

Emma Peterson
FREE Resource
Standards-aligned
Read more
10 questions
Show all answers
1.
MULTIPLE CHOICE QUESTION
30 sec • 1 pt
What is the basic form of the exponential functions discussed in the video?
f(x) = a * b^x + k
f(x) = a + b^x * k
f(x) = a * x^b + k
f(x) = a * b^k + x
Tags
CCSS.HSF-IF.C.7E
2.
MULTIPLE CHOICE QUESTION
30 sec • 1 pt
What happens to the graph when b is greater than 1?
The graph remains constant.
The graph becomes a linear function.
The graph shows exponential growth.
The graph shows exponential decay.
3.
MULTIPLE CHOICE QUESTION
30 sec • 1 pt
How does a positive value of k affect the graph?
Shifts the graph down k units.
Shifts the graph up k units.
Compresses the graph vertically.
Reflects the graph across the x-axis.
4.
MULTIPLE CHOICE QUESTION
30 sec • 1 pt
What effect does a negative value of 'a' have on the graph?
It stretches the graph vertically.
It shifts the graph horizontally.
It compresses the graph vertically.
It reflects the graph across the x-axis.
Tags
CCSS.HSF-IF.C.7D
5.
MULTIPLE CHOICE QUESTION
30 sec • 1 pt
What is indicated by a horizontal asymptote at y = -3?
The graph is shifted up 3 units.
The graph is shifted down 3 units.
The graph is reflected horizontally.
The graph is compressed vertically.
Tags
CCSS.HSF-IF.C.7E
6.
MULTIPLE CHOICE QUESTION
30 sec • 1 pt
Which of the following indicates exponential decay with a vertical reflection?
b > 1 and a > 0
b < 1 and a < 0
b > 1 and a < 0
b < 1 and a > 0
Tags
CCSS.HSF-IF.C.7D
7.
MULTIPLE CHOICE QUESTION
30 sec • 1 pt
What is the horizontal asymptote of the graph on the right?
y = 0
y = 1
y = 3
y = -3
Tags
CCSS.HSF.LE.A.2
Access all questions and much more by creating a free account
Create resources
Host any resource
Get auto-graded reports
Continue with Google

Continue with Email
Continue with Microsoft
or continue with

%20(1).png)
Apple
Others
Already have an account?
