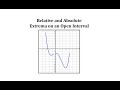
Understanding Extrema in Graphs
Interactive Video
•
Mathematics
•
9th - 12th Grade
•
Practice Problem
•
Hard
Standards-aligned

Olivia Brooks
FREE Resource
Standards-aligned
Read more
10 questions
Show all answers
1.
MULTIPLE CHOICE QUESTION
30 sec • 1 pt
What is a characteristic of a continuous function over an open interval?
It may not have any absolute extrema.
It is always increasing.
It always has an absolute maximum.
It is always decreasing.
2.
MULTIPLE CHOICE QUESTION
30 sec • 1 pt
What are critical points on a graph?
Points where the graph is vertical.
Points where the graph has high or low points or turns.
Points where the graph is horizontal.
Points where the graph is undefined.
Tags
CCSS.HSF-IF.C.7D
3.
MULTIPLE CHOICE QUESTION
30 sec • 1 pt
Why do we not consider endpoints in an open interval?
Because they are undefined.
Because they are always minimum points.
Because they are always maximum points.
Because they are not part of the graph.
4.
MULTIPLE CHOICE QUESTION
30 sec • 1 pt
Why is there no absolute maximum in the given graph?
Because the graph is decreasing.
Because the interval is open.
Because the endpoints are closed.
Because the graph is not continuous.
Tags
CCSS.HSF-IF.C.7A
5.
MULTIPLE CHOICE QUESTION
30 sec • 1 pt
What is the ordered pair for the low point on the right side of the graph?
(1.5, -5)
(2.9, -12)
(0, -3)
(-1.4, -4.1)
Tags
CCSS.HSF-IF.C.7A
6.
MULTIPLE CHOICE QUESTION
30 sec • 1 pt
What is the absolute minimum of the graph?
The y-value of 0 at x = 0
The y-value of -12 at x = 2.9
The y-value of -4.1 at x = -1.4
The y-value of -3 at x = 0
7.
MULTIPLE CHOICE QUESTION
30 sec • 1 pt
What does the point (-1.4, -4.1) represent on the graph?
An absolute maximum
An absolute minimum
A relative minimum
A relative maximum
Access all questions and much more by creating a free account
Create resources
Host any resource
Get auto-graded reports
Continue with Google

Continue with Email
Continue with Classlink
Continue with Clever
or continue with
Microsoft
%20(1).png)
Apple
Others
Already have an account?
