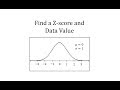
Understanding Normal Distribution and Z-Scores
Interactive Video
•
Mathematics
•
9th - 12th Grade
•
Practice Problem
•
Easy
Standards-aligned

Sophia Harris
Used 1+ times
FREE Resource
Standards-aligned
Read more
10 questions
Show all answers
1.
MULTIPLE CHOICE QUESTION
30 sec • 1 pt
What is the mean of the normally distributed variable x?
14
21
28
35
2.
MULTIPLE CHOICE QUESTION
30 sec • 1 pt
If the standard deviation is 7, what is the value of x that is one standard deviation to the right of the mean?
14
21
35
28
3.
MULTIPLE CHOICE QUESTION
30 sec • 1 pt
How do you calculate the z-score for a given value of x?
Divide the mean by the value of x
Multiply the mean by the standard deviation
Subtract the mean from x and divide by the standard deviation
Add the mean to the value of x
4.
MULTIPLE CHOICE QUESTION
30 sec • 1 pt
What is the z-score for x = 25?
0.57
1.00
1.14
0.75
5.
MULTIPLE CHOICE QUESTION
30 sec • 1 pt
For x = 13, what is the approximate z-score?
-0.57
-1.14
-0.75
-1.00
Tags
CCSS.HSS.ID.A.4
6.
MULTIPLE CHOICE QUESTION
30 sec • 1 pt
If a z-score is 1.6, what is the corresponding value of x?
21
28
35
32.2
Tags
CCSS.HSS.ID.A.4
7.
MULTIPLE CHOICE QUESTION
30 sec • 1 pt
What value of x corresponds to a z-score of -0.8?
18.2
15.4
21
25
Tags
CCSS.HSS.ID.A.4
Access all questions and much more by creating a free account
Create resources
Host any resource
Get auto-graded reports
Continue with Google

Continue with Email
Continue with Microsoft
or continue with

%20(1).png)
Apple
Others
Already have an account?
