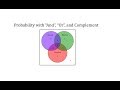
Student Participation and Probability Analysis
Interactive Video
•
Mathematics
•
7th - 10th Grade
•
Practice Problem
•
Hard
+6
Standards-aligned

Jackson Turner
FREE Resource
Standards-aligned
Read more
10 questions
Show all answers
1.
MULTIPLE CHOICE QUESTION
30 sec • 1 pt
What was the total number of students surveyed at the ballroom dance studio?
50
75
100
67
Tags
CCSS.6.SP.A.2
2.
MULTIPLE CHOICE QUESTION
30 sec • 1 pt
How is the probability of students competing in 'Smooth' expressed as a percentage?
50.0%
70.0%
61.2%
41.0%
Tags
CCSS.1.NBT.A.1
3.
MULTIPLE CHOICE QUESTION
30 sec • 1 pt
What is the total number of students who competed in 'Smooth'?
41
36
26
51
Tags
CCSS.8.SP.A.4
4.
MULTIPLE CHOICE QUESTION
30 sec • 1 pt
What is the probability of students competing in both 'Rhythm' and 'Standard' categories?
56/67
41/67
28/67
19/67
Tags
CCSS.HSS.CP.A.2
CCSS.HSS.CP.A.4
5.
MULTIPLE CHOICE QUESTION
30 sec • 1 pt
What percentage represents the probability of students competing in both 'Rhythm' and 'Standard'?
18.4%
28.4%
48.4%
38.4%
Tags
CCSS.HSA.CED.A.3
6.
MULTIPLE CHOICE QUESTION
30 sec • 1 pt
How many students competed in either 'Smooth' or 'Standard' categories?
56
51
46
41
Tags
CCSS.HSS.CP.B.7
7.
MULTIPLE CHOICE QUESTION
30 sec • 1 pt
What is the probability of students competing in either 'Smooth' or 'Standard' expressed as a percentage?
73.6%
83.6%
93.6%
63.6%
Tags
CCSS.8.SP.A.4
Access all questions and much more by creating a free account
Create resources
Host any resource
Get auto-graded reports
Continue with Google

Continue with Email
Continue with Classlink
Continue with Clever
or continue with
Microsoft
%20(1).png)
Apple
Others
Already have an account?
Popular Resources on Wayground

8 questions
Spartan Way - Classroom Responsible
Quiz
•
9th - 12th Grade
15 questions
Fractions on a Number Line
Quiz
•
3rd Grade
14 questions
Boundaries & Healthy Relationships
Lesson
•
6th - 8th Grade
20 questions
Equivalent Fractions
Quiz
•
3rd Grade
3 questions
Integrity and Your Health
Lesson
•
6th - 8th Grade
25 questions
Multiplication Facts
Quiz
•
5th Grade
9 questions
FOREST Perception
Lesson
•
KG
20 questions
Main Idea and Details
Quiz
•
5th Grade
Discover more resources for Mathematics
20 questions
Scatter Plots and Line of Best Fit
Quiz
•
8th Grade
12 questions
8th U6 L4 - Fitting a Line to Data
Quiz
•
8th Grade
14 questions
Volume of rectangular prisms
Quiz
•
7th Grade
25 questions
Scatter Plots and Line of Best Fit
Quiz
•
8th Grade
14 questions
finding slope from a graph
Quiz
•
8th Grade
20 questions
Graphing Inequalities on a Number Line
Quiz
•
6th - 9th Grade
18 questions
Identifying Radius/Diameter
Quiz
•
7th Grade
20 questions
Pythagorean Theorem Review
Quiz
•
8th Grade