Coffee and Tea Survey Analysis
Interactive Video
•
Mathematics, Science
•
6th - 8th Grade
•
Practice Problem
•
Hard

Liam Anderson
FREE Resource
Read more
10 questions
Show all answers
1.
MULTIPLE CHOICE QUESTION
30 sec • 1 pt
What was the total number of people surveyed about their morning beverage preferences?
250
200
150
100
2.
MULTIPLE CHOICE QUESTION
30 sec • 1 pt
How many people reported drinking only tea in the morning?
66
36
46
56
3.
MULTIPLE CHOICE QUESTION
30 sec • 1 pt
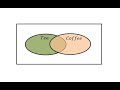
In the Venn diagram, where are the people who drink only coffee placed?
Outside both sets
In the coffee set
In the intersection
In the tea set
4.
MULTIPLE CHOICE QUESTION
30 sec • 1 pt
How many people drink both coffee and tea?
68
58
78
88
5.
MULTIPLE CHOICE QUESTION
30 sec • 1 pt
What is the total number of people who drink neither coffee nor tea?
15
20
25
10
6.
MULTIPLE CHOICE QUESTION
30 sec • 1 pt
How many people drink tea in the morning according to the Venn diagram?
94
104
114
124
7.
MULTIPLE CHOICE QUESTION
30 sec • 1 pt
What is the sum of people who drink only tea and those who drink both beverages?
124
114
104
94
Access all questions and much more by creating a free account
Create resources
Host any resource
Get auto-graded reports
Continue with Google

Continue with Email
Continue with Classlink
Continue with Clever
or continue with
Microsoft
%20(1).png)
Apple
Others
Already have an account?
