Survey Analysis of Beverage Consumption
Interactive Video
•
Mathematics, Science
•
6th - 9th Grade
•
Practice Problem
•
Hard

Liam Anderson
FREE Resource
Read more
10 questions
Show all answers
1.
MULTIPLE CHOICE QUESTION
30 sec • 1 pt
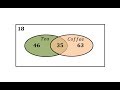
What are the beverage options provided in the survey?
Tea, Coffee, Milk, Soda
Tea only, Coffee only, Both, Neither
Tea only, Coffee only, Juice, Water
Tea, Coffee, Juice, Water
2.
MULTIPLE CHOICE QUESTION
30 sec • 1 pt
How many people drink only coffee according to the Venn diagram?
46
35
63
98
3.
MULTIPLE CHOICE QUESTION
30 sec • 1 pt
What is the total number of coffee drinkers?
35
98
64
63
4.
MULTIPLE CHOICE QUESTION
30 sec • 1 pt
How do you calculate the total number of coffee drinkers?
Add those who drink only tea and those who drink neither
Subtract those who drink neither from those who drink both
Add those who drink only coffee and those who drink both coffee and tea
Subtract those who drink only tea from those who drink coffee
5.
MULTIPLE CHOICE QUESTION
30 sec • 1 pt
How many people do not drink coffee?
81
64
98
162
6.
MULTIPLE CHOICE QUESTION
30 sec • 1 pt
What is the method to find the number of people who do not drink coffee?
Subtract those who drink only tea from those who drink neither
Add those who drink only tea and those who drink neither
Subtract those who drink both from those who drink only coffee
Add those who drink only coffee and those who drink both
7.
MULTIPLE CHOICE QUESTION
30 sec • 1 pt
How many people do not drink tea?
162
98
64
81
Access all questions and much more by creating a free account
Create resources
Host any resource
Get auto-graded reports
Continue with Google

Continue with Email
Continue with Classlink
Continue with Clever
or continue with
Microsoft
%20(1).png)
Apple
Others
Already have an account?
