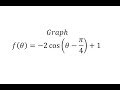
Graphing a Transformed Cosine Function
Interactive Video
•
Mathematics
•
9th - 12th Grade
•
Practice Problem
•
Hard
Standards-aligned

Lucas Foster
FREE Resource
Standards-aligned
Read more
10 questions
Show all answers
1.
MULTIPLE CHOICE QUESTION
30 sec • 1 pt
What is the initial step in sketching the graph of the given function?
Determining the y-intercepts
Calculating the derivative
Finding the x-intercepts
Identifying the function's parameters
Tags
CCSS.HSF-IF.C.7E
2.
MULTIPLE CHOICE QUESTION
30 sec • 1 pt
What is the amplitude of the function f(θ) = -2cos(θ - π/4) + 1?
4
2
3
1
Tags
CCSS.HSF-IF.C.7E
3.
MULTIPLE CHOICE QUESTION
30 sec • 1 pt
How does a negative amplitude affect the graph of a cosine function?
It shifts the graph upwards
It shifts the graph downwards
It reflects the graph across the midline
It stretches the graph vertically
Tags
CCSS.HSF.TF.A.4
4.
MULTIPLE CHOICE QUESTION
30 sec • 1 pt
What is the period of the function f(θ) = -2cos(θ - π/4) + 1?
2π
4π
π
π/2
Tags
CCSS.HSF-IF.C.7E
5.
MULTIPLE CHOICE QUESTION
30 sec • 1 pt
What is the phase shift of the function f(θ) = -2cos(θ - π/4) + 1?
Left π/4
Right π/2
Right π/4
Left π/2
Tags
CCSS.HSF-IF.C.7E
6.
MULTIPLE CHOICE QUESTION
30 sec • 1 pt
What is the vertical shift of the function f(θ) = -2cos(θ - π/4) + 1?
Down 2 units
Down 1 unit
Up 1 unit
Up 2 units
Tags
CCSS.HSF-IF.C.7E
7.
MULTIPLE CHOICE QUESTION
30 sec • 1 pt
What is the midline of the function f(θ) = -2cos(θ - π/4) + 1?
y = 2
y = 0
y = 1
y = -1
Tags
CCSS.HSF-IF.C.7E
Access all questions and much more by creating a free account
Create resources
Host any resource
Get auto-graded reports
Continue with Google

Continue with Email
Continue with Classlink
Continue with Clever
or continue with
Microsoft
%20(1).png)
Apple
Others
Already have an account?
Popular Resources on Wayground

7 questions
History of Valentine's Day
Interactive video
•
4th Grade
15 questions
Fractions on a Number Line
Quiz
•
3rd Grade
20 questions
Equivalent Fractions
Quiz
•
3rd Grade
25 questions
Multiplication Facts
Quiz
•
5th Grade
22 questions
fractions
Quiz
•
3rd Grade
15 questions
Valentine's Day Trivia
Quiz
•
3rd Grade
20 questions
Main Idea and Details
Quiz
•
5th Grade
20 questions
Context Clues
Quiz
•
6th Grade
Discover more resources for Mathematics
20 questions
Graphing Inequalities on a Number Line
Quiz
•
6th - 9th Grade
20 questions
Exponent Properties
Quiz
•
9th Grade
15 questions
Combine Like Terms and Distributive Property
Quiz
•
8th - 9th Grade
20 questions
Function or Not a Function
Quiz
•
8th - 9th Grade
10 questions
Factor Quadratic Expressions with Various Coefficients
Quiz
•
9th - 12th Grade
10 questions
Elijah McCoy: Innovations and Impact in Black History
Interactive video
•
6th - 10th Grade
10 questions
Evaluating Piecewise Functions Practice
Quiz
•
11th Grade
21 questions
Factoring Trinomials (a=1)
Quiz
•
9th Grade