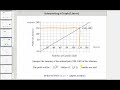
Understanding Graphical Interpretations
Interactive Video
•
Mathematics, Business
•
6th - 10th Grade
•
Practice Problem
•
Hard
Standards-aligned

Jackson Turner
FREE Resource
Standards-aligned
Read more
10 questions
Show all answers
1.
MULTIPLE CHOICE QUESTION
30 sec • 1 pt
What does the first value in an ordered pair represent in a graph?
The horizontal intercept
The input value
The vertical intercept
The output value
Tags
CCSS.8.EE.B.5
2.
MULTIPLE CHOICE QUESTION
30 sec • 1 pt
In the context of the video, what does the ordered pair (120, 150) signify?
A loss of $150 when 120 candles are sold
A break-even point at 120 candles
150 candles sold with a profit of $120
120 candles sold with a profit of $150
3.
MULTIPLE CHOICE QUESTION
30 sec • 1 pt
What is the vertical intercept in a graph?
The point where the output is maximum
The point where the input is maximum
The point where the graph intersects the vertical axis
The point where the graph intersects the horizontal axis
Tags
CCSS.HSF.LE.B.5
4.
MULTIPLE CHOICE QUESTION
30 sec • 1 pt
If zero candles are sold, what is the profit according to the vertical intercept?
$0 profit
$50 gain
$50 profit
$50 loss
Tags
CCSS.HSF.LE.B.5
5.
MULTIPLE CHOICE QUESTION
30 sec • 1 pt
What does a negative profit indicate?
A surplus
A break-even point
A loss
A gain
6.
MULTIPLE CHOICE QUESTION
30 sec • 1 pt
What is the horizontal intercept in a graph?
The point where the input is zero
The point where the graph intersects the vertical axis
The point where the output is maximum
The point where the graph intersects the horizontal axis
Tags
CCSS.HSF-IF.C.7A
7.
MULTIPLE CHOICE QUESTION
30 sec • 1 pt
What does the horizontal intercept signify in the context of the video?
A profit of $30
A break-even point
A maximum profit
A loss of $30
Tags
CCSS.HSF-IF.C.7A
Access all questions and much more by creating a free account
Create resources
Host any resource
Get auto-graded reports
Continue with Google

Continue with Email
Continue with Classlink
Continue with Clever
or continue with
Microsoft
%20(1).png)
Apple
Others
Already have an account?
Popular Resources on Wayground

15 questions
Fractions on a Number Line
Quiz
•
3rd Grade
20 questions
Equivalent Fractions
Quiz
•
3rd Grade
25 questions
Multiplication Facts
Quiz
•
5th Grade
54 questions
Analyzing Line Graphs & Tables
Quiz
•
4th Grade
22 questions
fractions
Quiz
•
3rd Grade
20 questions
Main Idea and Details
Quiz
•
5th Grade
20 questions
Context Clues
Quiz
•
6th Grade
15 questions
Equivalent Fractions
Quiz
•
4th Grade
Discover more resources for Mathematics
22 questions
distributive property
Quiz
•
7th Grade
18 questions
Angle Relationships
Quiz
•
7th Grade
15 questions
Distributive Property & Review
Quiz
•
6th Grade
20 questions
Writing Algebraic Expressions
Quiz
•
6th Grade
20 questions
How Some Friendships Last — and Others Don’t Video Questions
Quiz
•
7th Grade
14 questions
finding slope from a graph
Quiz
•
8th Grade
20 questions
Ratios/Rates and Unit Rates
Quiz
•
6th Grade
18 questions
Handbook Refresher Quiz
Quiz
•
7th Grade