Predicting the Year of Zero High School Smokers
Interactive Video
•
Mathematics
•
9th - 12th Grade
•
Practice Problem
•
Hard
Standards-aligned

Aiden Montgomery
FREE Resource
Standards-aligned
Read more
8 questions
Show all answers
1.
MULTIPLE CHOICE QUESTION
30 sec • 1 pt
What is the main goal of using the given equation in the context of high school smokers?
To determine the increase in smokers over time
To calculate the average number of smokers per year
To predict the year when there will be zero smokers per 100 students
To find the number of smokers in 2011
Tags
CCSS.HSF.LE.B.5
2.
MULTIPLE CHOICE QUESTION
30 sec • 1 pt
In the equation, what does the variable 'x' represent?
The year when there will be zero smokers
The total number of students
The number of years since 2011
The number of smokers per 100 students
3.
MULTIPLE CHOICE QUESTION
30 sec • 1 pt
How do you find the x-intercept of the linear equation?
By calculating the slope of the line
By finding the midpoint of the line
By setting y to zero and solving for x
By setting x to zero and solving for y
4.
MULTIPLE CHOICE QUESTION
30 sec • 1 pt
What is the approximate value of x when y equals zero in the given equation?
8.5
9.14
7.9
10.2
Tags
CCSS.HSF.LE.B.5
5.
MULTIPLE CHOICE QUESTION
30 sec • 1 pt
What year does the x value of approximately 9.14 correspond to?
2022
2021
2019
2020
Tags
CCSS.HSF.LE.B.5
6.
MULTIPLE CHOICE QUESTION
30 sec • 1 pt
What is the significance of the x-intercept in the context of the problem?
It represents the year when the number of smokers will be at its peak
It indicates the year when there will be zero smokers per 100 students
It shows the average number of smokers per year
It marks the starting point of the data collection
Tags
CCSS.HSF.LE.B.5
7.
MULTIPLE CHOICE QUESTION
30 sec • 1 pt
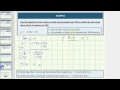
What does the graph of the equation y = -1.75x + 16 illustrate?
The decrease in smokers over time
The constant number of smokers over time
The increase in smokers over time
The fluctuation in the number of smokers
Access all questions and much more by creating a free account
Create resources
Host any resource
Get auto-graded reports
Continue with Google

Continue with Email
Continue with Classlink
Continue with Clever
or continue with
Microsoft
%20(1).png)
Apple
Others
Already have an account?
