Understanding Bar Graphs and Percentages
Interactive Video
•
Mathematics
•
5th - 8th Grade
•
Practice Problem
•
Hard
+4
Standards-aligned

Jackson Turner
FREE Resource
Standards-aligned
Read more
10 questions
Show all answers
1.
MULTIPLE CHOICE QUESTION
30 sec • 1 pt
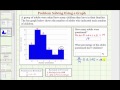
What does the horizontal axis of the bar graph represent?
The percentage of adults
The frequency of responses
The number of children
The number of adults
Tags
CCSS.8.SP.A.1
2.
MULTIPLE CHOICE QUESTION
30 sec • 1 pt
How many adults reported having zero children?
Six
Two
Five
Three
Tags
CCSS.6.SP.B.5A
3.
MULTIPLE CHOICE QUESTION
30 sec • 1 pt
What is the total number of adults who participated in the survey?
15
19
21
25
Tags
CCSS.3.NF.A.1
CCSS.3.NF.A.2B
4.
MULTIPLE CHOICE QUESTION
30 sec • 1 pt
What fraction of adults reported having five children?
2/19
3/19
1/19
4/19
5.
MULTIPLE CHOICE QUESTION
30 sec • 1 pt
How do you convert a fraction to a percentage?
Add 50
Multiply by 100
Multiply by 10
Divide by 100
Tags
CCSS.6.RP.A.3C
6.
MULTIPLE CHOICE QUESTION
30 sec • 1 pt
What is the percentage of adults who have five children?
8.5%
5.5%
12.5%
10.5%
7.
MULTIPLE CHOICE QUESTION
30 sec • 1 pt
In a percent proportion, what is the number 100 used for?
To find the median
To calculate the average
To compare the percentage
To represent the total number of adults
Tags
CCSS.6.RP.A.3C
Access all questions and much more by creating a free account
Create resources
Host any resource
Get auto-graded reports
Continue with Google

Continue with Email
Continue with Microsoft
or continue with

%20(1).png)
Apple
Others
Already have an account?
