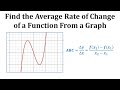
Understanding Average Rate of Change
Interactive Video
•
Mathematics
•
7th - 10th Grade
•
Practice Problem
•
Medium
+5
Standards-aligned

Sophia Harris
Used 3+ times
FREE Resource
Standards-aligned
Read more
10 questions
Show all answers
1.
MULTIPLE CHOICE QUESTION
30 sec • 1 pt
What is the first step in determining the average rate of change from a graph?
Determine the function's maximum value
Identify the coordinates of the points
Calculate the area under the curve
Find the slope of the line
Tags
CCSS.8.F.B.4
CCSS.HSF.IF.B.6
2.
MULTIPLE CHOICE QUESTION
30 sec • 1 pt
When finding the average rate of change, what do the inputs and outputs refer to?
Inputs are X values, outputs are Y values
Inputs are Y values, outputs are X values
Inputs are coordinates, outputs are slopes
Inputs are slopes, outputs are coordinates
Tags
CCSS.8.F.B.4
CCSS.HSF.IF.B.6
3.
MULTIPLE CHOICE QUESTION
30 sec • 1 pt
How do you calculate the average rate of change between two points?
Divide the change in X by the change in Y
Divide the change in Y by the change in X
Subtract the change in X from the change in Y
Multiply the change in Y by the change in X
Tags
CCSS.8.F.B.4
CCSS.HSF.IF.B.6
4.
MULTIPLE CHOICE QUESTION
30 sec • 1 pt
What does an average rate of change of 3 over 1 indicate?
The function increases by 1 unit for every 3 units increase in X
The function remains constant
The function increases by 3 units for every 1 unit increase in X
The function decreases by 3 units for every 1 unit increase in X
Tags
CCSS.8.F.B.4
CCSS.HSF.IF.B.6
5.
MULTIPLE CHOICE QUESTION
30 sec • 1 pt
Why is it helpful to express the average rate of change in fraction form?
It reduces the number of calculations needed
It provides a clearer interpretation of the change
It makes the function easier to graph
It simplifies the calculation
Tags
CCSS.8.F.B.4
CCSS.HSF.IF.B.6
6.
MULTIPLE CHOICE QUESTION
30 sec • 1 pt
What is the average rate of change from X = 2 to X = 5?
2
3
5
7
Tags
CCSS.8.F.B.4
CCSS.HSF.IF.B.6
7.
MULTIPLE CHOICE QUESTION
30 sec • 1 pt
How does the average rate of change relate to the slope of a line segment on a graph?
It is equal to the slope
It is twice the slope
It is unrelated to the slope
It is the inverse of the slope
Tags
CCSS.8.F.B.4
CCSS.HSF.IF.B.6
Access all questions and much more by creating a free account
Create resources
Host any resource
Get auto-graded reports
Continue with Google

Continue with Email
Continue with Classlink
Continue with Clever
or continue with
Microsoft
%20(1).png)
Apple
Others
Already have an account?
