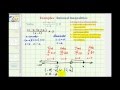
Rational Inequalities and Graphing Concepts
Interactive Video
•
Mathematics
•
9th - 12th Grade
•
Practice Problem
•
Hard
Standards-aligned

Emma Peterson
FREE Resource
Standards-aligned
Read more
10 questions
Show all answers
1.
MULTIPLE CHOICE QUESTION
30 sec • 1 pt
What is the first step in solving a rational inequality?
Expressing the solution in interval notation
Testing intervals
Plotting the zeros on a number line
Factoring the numerator and denominator
2.
MULTIPLE CHOICE QUESTION
30 sec • 1 pt
When plotting zeros on a number line, what determines if a point is open or closed?
The value of the numerator
The number of intervals
The value of the denominator
The original inequality
3.
MULTIPLE CHOICE QUESTION
30 sec • 1 pt
Why must zeros of the denominator always be open points?
To avoid division by zero
To include them in the solution
To simplify the inequality
To ensure all intervals are tested
4.
MULTIPLE CHOICE QUESTION
30 sec • 1 pt
Which value is tested in the interval where x = -3?
x = -3
x = 7
x = 3
x = 0
5.
MULTIPLE CHOICE QUESTION
30 sec • 1 pt
What is the result when testing x = 0 in the inequality?
The interval is part of the solution
The interval is undefined
The interval is not part of the solution
The interval is always positive
6.
MULTIPLE CHOICE QUESTION
30 sec • 1 pt
How is the solution expressed using interval notation?
From 2 to positive infinity
From negative infinity to 6
From negative infinity to -2, union 2 to 6
From -2 to 2
Tags
CCSS.HSA.REI.A.2
7.
MULTIPLE CHOICE QUESTION
30 sec • 1 pt
What does the graph of the function help verify?
The zeros of the denominator
The factors of the numerator
The number of solutions
The intervals that satisfy the inequality
Tags
CCSS.HSF-IF.C.7D
Access all questions and much more by creating a free account
Create resources
Host any resource
Get auto-graded reports
Continue with Google

Continue with Email
Continue with Classlink
Continue with Clever
or continue with
Microsoft
%20(1).png)
Apple
Others
Already have an account?
