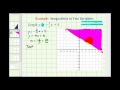
Graphing Inequalities and Test Points
Interactive Video
•
Mathematics
•
8th - 10th Grade
•
Practice Problem
•
Hard
Standards-aligned

Olivia Brooks
FREE Resource
Standards-aligned
Read more
10 questions
Show all answers
1.
MULTIPLE CHOICE QUESTION
30 sec • 1 pt
What is the first step in graphing the inequality y ≥ -2/3x + 4?
Shade the region above the line
Plot the y-intercept and use the slope
Draw a dashed line
Test a point in the region
Tags
CCSS.HSA.REI.D.12
2.
MULTIPLE CHOICE QUESTION
30 sec • 1 pt
When should you use a solid line while graphing an inequality?
When the inequality is strict (< or >)
When the y-intercept is zero
When the inequality includes equality (≤ or ≥)
When the slope is positive
3.
MULTIPLE CHOICE QUESTION
30 sec • 1 pt
How do you determine additional points on the line y = -2/3x + 4?
By using the x-intercept
By testing random points
By using the slope to move from the y-intercept
By drawing a horizontal line
Tags
CCSS.8.EE.B.6
CCSS.8.F.A.3
4.
MULTIPLE CHOICE QUESTION
30 sec • 1 pt
What does the slope -2/3 represent in the equation y = -2/3x + 4?
The x-intercept
The y-intercept
The change in y for a unit change in x
The change in x for a unit change in y
Tags
CCSS.8.EE.B.6
CCSS.8.F.A.3
5.
MULTIPLE CHOICE QUESTION
30 sec • 1 pt
What is the y-intercept of the line y = -2/3x + 4?
0
4
-2/3
3
Tags
CCSS.HSA.REI.D.12
6.
MULTIPLE CHOICE QUESTION
30 sec • 1 pt
Which region should be shaded for the inequality y ≥ -2/3x + 4?
Below the line
Above the line
On the line
To the left of the line
Tags
CCSS.HSA.REI.D.12
7.
MULTIPLE CHOICE QUESTION
30 sec • 1 pt
What is the purpose of testing points when graphing inequalities?
To verify the correct region is shaded
To find the slope
To calculate the x-intercept
To determine the y-intercept
Tags
CCSS.HSA.REI.D.12
Access all questions and much more by creating a free account
Create resources
Host any resource
Get auto-graded reports
Continue with Google

Continue with Email
Continue with Classlink
Continue with Clever
or continue with
Microsoft
%20(1).png)
Apple
Others
Already have an account?
Popular Resources on Wayground

8 questions
Spartan Way - Classroom Responsible
Quiz
•
9th - 12th Grade
15 questions
Fractions on a Number Line
Quiz
•
3rd Grade
14 questions
Boundaries & Healthy Relationships
Lesson
•
6th - 8th Grade
20 questions
Equivalent Fractions
Quiz
•
3rd Grade
3 questions
Integrity and Your Health
Lesson
•
6th - 8th Grade
25 questions
Multiplication Facts
Quiz
•
5th Grade
9 questions
FOREST Perception
Lesson
•
KG
20 questions
Main Idea and Details
Quiz
•
5th Grade
Discover more resources for Mathematics
20 questions
Scatter Plots and Line of Best Fit
Quiz
•
8th Grade
12 questions
8th U6 L4 - Fitting a Line to Data
Quiz
•
8th Grade
25 questions
Scatter Plots and Line of Best Fit
Quiz
•
8th Grade
14 questions
finding slope from a graph
Quiz
•
8th Grade
20 questions
Graphing Inequalities on a Number Line
Quiz
•
6th - 9th Grade
20 questions
Pythagorean Theorem Review
Quiz
•
8th Grade
20 questions
Laws of Exponents
Quiz
•
8th Grade
11 questions
Adding and Subtracting Polynomials
Quiz
•
9th Grade