Understanding Graphing of Linear Equations with One Variable
Interactive Video
•
Mathematics
•
6th - 8th Grade
•
Practice Problem
•
Hard
Standards-aligned

Ethan Morris
FREE Resource
Standards-aligned
Read more
10 questions
Show all answers
1.
MULTIPLE CHOICE QUESTION
30 sec • 1 pt
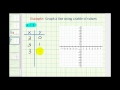
What type of line is formed by the equation X = 3?
Horizontal line
Vertical line
Curved line
Diagonal line
Tags
CCSS.8.F.A.1
CCSS.HSF.IF.A.1
2.
MULTIPLE CHOICE QUESTION
30 sec • 1 pt
In a T-table for the equation X = 3, what can the Y values be?
Only negative numbers
Only positive numbers
Only 0
Any value
3.
MULTIPLE CHOICE QUESTION
30 sec • 1 pt
What does the equation X = 3 tell us about the X-coordinates of points on the line?
They must be 3
They can be any value
They must be negative
They must be 0
Tags
CCSS.8.F.A.1
CCSS.HSF.IF.A.1
4.
MULTIPLE CHOICE QUESTION
30 sec • 1 pt
What is the significance of the Y-values in the T-table for X = 3?
They can be any value
They determine the slope
They must be positive
They are irrelevant
Tags
CCSS.8.F.A.1
CCSS.HSF.IF.A.1
5.
MULTIPLE CHOICE QUESTION
30 sec • 1 pt
What does the T-table help us understand about the equation X = 3?
The curvature of the line
The midpoint of the line
The constant nature of X
The slope of the line
6.
MULTIPLE CHOICE QUESTION
30 sec • 1 pt
What does the point (3,0) represent on the graph of X = 3?
Y-intercept
Origin
X-intercept
Midpoint
Tags
CCSS.5.G.A.2
7.
MULTIPLE CHOICE QUESTION
30 sec • 1 pt
How do you plot the point (3,1) on the graph?
Move right 3 units and up 1 unit
Move left 3 units and down 1 unit
Move up 3 units and right 1 unit
Move down 3 units and left 1 unit
Access all questions and much more by creating a free account
Create resources
Host any resource
Get auto-graded reports
Continue with Google

Continue with Email
Continue with Microsoft
or continue with

%20(1).png)
Apple
Others
Already have an account?
