Understanding Derivatives and Graphing Functions
Interactive Video
•
Mathematics
•
9th - 12th Grade
•
Practice Problem
•
Hard
Standards-aligned

Emma Peterson
FREE Resource
Standards-aligned
Read more
10 questions
Show all answers
1.
MULTIPLE CHOICE QUESTION
30 sec • 1 pt
What does it mean for a function if its derivative is positive on an interval?
The function is constant on that interval.
The function has a maximum on that interval.
The function is decreasing on that interval.
The function is increasing on that interval.
Tags
CCSS.HSF.IF.B.4
2.
MULTIPLE CHOICE QUESTION
30 sec • 1 pt
How do we represent open intervals on a number line when plotting derivative information?
With dashed lines.
With arrows.
With open points.
With closed points.
3.
MULTIPLE CHOICE QUESTION
30 sec • 1 pt
What happens to a function at a point where its derivative changes from positive to negative?
The function has a relative maximum.
The function has an inflection point.
The function has a relative minimum.
The function is constant.
4.
MULTIPLE CHOICE QUESTION
30 sec • 1 pt
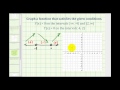
At which x-values does the function have critical points in this example?
x = 0 and x = 3
x = -4 and x = 2
x = -2 and x = 4
x = -3 and x = 5
5.
MULTIPLE CHOICE QUESTION
30 sec • 1 pt
What is the behavior of the function between x = -4 and x = 2?
The function has a maximum.
The function is constant.
The function is decreasing.
The function is increasing.
6.
MULTIPLE CHOICE QUESTION
30 sec • 1 pt
What is the significance of a relative maximum in the context of this function?
It is the highest point in the entire graph.
It is a point where the function is constant.
It is a point where the function changes from increasing to decreasing.
It is a point where the function changes from decreasing to increasing.
7.
MULTIPLE CHOICE QUESTION
30 sec • 1 pt
What does the derivative tell us about the function at x = 2?
The function is undefined at x = 2.
The function has a relative minimum at x = 2.
The function has a relative maximum at x = 2.
The function is constant at x = 2.
Access all questions and much more by creating a free account
Create resources
Host any resource
Get auto-graded reports
Continue with Google

Continue with Email
Continue with Classlink
Continue with Clever
or continue with
Microsoft
%20(1).png)
Apple
Others
Already have an account?
Popular Resources on Wayground

15 questions
Fractions on a Number Line
Quiz
•
3rd Grade
20 questions
Equivalent Fractions
Quiz
•
3rd Grade
25 questions
Multiplication Facts
Quiz
•
5th Grade
29 questions
Alg. 1 Section 5.1 Coordinate Plane
Quiz
•
9th Grade
22 questions
fractions
Quiz
•
3rd Grade
11 questions
FOREST Effective communication
Lesson
•
KG
20 questions
Main Idea and Details
Quiz
•
5th Grade
20 questions
Context Clues
Quiz
•
6th Grade
Discover more resources for Mathematics
29 questions
Alg. 1 Section 5.1 Coordinate Plane
Quiz
•
9th Grade
20 questions
Graphing Inequalities on a Number Line
Quiz
•
6th - 9th Grade
20 questions
Box and Whisker Plots
Quiz
•
9th Grade
18 questions
Exponential Growth and Decay
Quiz
•
9th Grade
20 questions
Function or Not a Function
Quiz
•
8th - 9th Grade
20 questions
SSS/SAS
Quiz
•
9th - 12th Grade
14 questions
Making Inferences From Samples
Quiz
•
7th - 12th Grade
23 questions
CCG - CH8 Polygon angles and area Review
Quiz
•
9th - 12th Grade