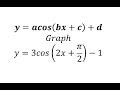
Understanding Cosine Functions and Graphs
Interactive Video
•
Mathematics
•
9th - 12th Grade
•
Practice Problem
•
Hard
Standards-aligned

Ethan Morris
FREE Resource
Standards-aligned
Read more
10 questions
Show all answers
1.
MULTIPLE CHOICE QUESTION
30 sec • 1 pt
What is the amplitude of a cosine function if the absolute value of 'a' is 5?
1
5
10
2.5
Tags
CCSS.HSF-IF.C.7E
2.
MULTIPLE CHOICE QUESTION
30 sec • 1 pt
If 'b' is 4 in the cosine function, what is the period?
π
2π
4π
π/2
Tags
CCSS.HSF-IF.C.7E
3.
MULTIPLE CHOICE QUESTION
30 sec • 1 pt
What is the phase shift if 'c' is π and 'b' is 2?
π/2 to the right
π/2 to the left
π to the right
π to the left
Tags
CCSS.HSF-IF.C.7E
4.
MULTIPLE CHOICE QUESTION
30 sec • 1 pt
How does a negative 'd' value affect the graph of a cosine function?
Shifts right
Shifts left
Shifts down
Shifts up
Tags
CCSS.HSF-IF.C.7E
5.
MULTIPLE CHOICE QUESTION
30 sec • 1 pt
Where is the midline of the graph if 'd' is -3?
y = 1
y = 0
y = -3
y = 3
Tags
CCSS.HSF-IF.C.7E
6.
MULTIPLE CHOICE QUESTION
30 sec • 1 pt
What is the maximum value of the function if the amplitude is 4 and the midline is y = -2?
6
2
0
4
Tags
CCSS.HSF-IF.C.7E
7.
MULTIPLE CHOICE QUESTION
30 sec • 1 pt
How many sub-intervals are used to graph one period of a cosine function?
2
3
5
4
Tags
CCSS.HSF-IF.C.7E
Access all questions and much more by creating a free account
Create resources
Host any resource
Get auto-graded reports
Continue with Google

Continue with Email
Continue with Classlink
Continue with Clever
or continue with
Microsoft
%20(1).png)
Apple
Others
Already have an account?
