Student Population Growth Analysis
Interactive Video
•
Mathematics
•
7th - 10th Grade
•
Practice Problem
•
Hard
Standards-aligned

Mia Campbell
FREE Resource
Standards-aligned
Read more
7 questions
Show all answers
1.
MULTIPLE CHOICE QUESTION
30 sec • 1 pt
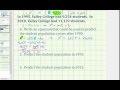
What was the increase in the student population at Valley College from 1995 to 2010?
1,875 students
2,000 students
1,500 students
2,500 students
Tags
CCSS.HSF.LE.A.4
2.
MULTIPLE CHOICE QUESTION
30 sec • 1 pt
How many years did it take for the student population to grow from 9,254 to 11,129?
10 years
15 years
20 years
25 years
3.
MULTIPLE CHOICE QUESTION
30 sec • 1 pt
What was the average annual growth rate of the student population between 1995 and 2010?
100 students per year
150 students per year
125 students per year
175 students per year
Tags
CCSS.HSF.LE.B.5
4.
MULTIPLE CHOICE QUESTION
30 sec • 1 pt
In the equation p = 125t + b, what does the '125' represent?
The vertical intercept
The initial student population
The number of years after 1990
The average annual growth rate
Tags
CCSS.HSF-IF.C.7A
5.
MULTIPLE CHOICE QUESTION
30 sec • 1 pt
What is the vertical intercept 'b' in the equation p = 125t + b?
7,500
11,129
9,254
8,629
Tags
CCSS.HSF.LE.B.5
6.
MULTIPLE CHOICE QUESTION
30 sec • 1 pt
Using the equation p = 125t + 8,629, what is the predicted student population in 1993?
9,004 students
9,500 students
9,254 students
8,629 students
Tags
CCSS.HSF.LE.B.5
7.
MULTIPLE CHOICE QUESTION
30 sec • 1 pt
Using the equation p = 125t + 8,629, what is the predicted student population in 2015?
11,754 students
11,000 students
11,500 students
12,000 students
Tags
CCSS.HSF.LE.B.5
Access all questions and much more by creating a free account
Create resources
Host any resource
Get auto-graded reports
Continue with Google

Continue with Email
Continue with Classlink
Continue with Clever
or continue with
Microsoft
%20(1).png)
Apple
Others
Already have an account?
Similar Resources on Wayground
Popular Resources on Wayground

8 questions
Spartan Way - Classroom Responsible
Quiz
•
9th - 12th Grade
15 questions
Fractions on a Number Line
Quiz
•
3rd Grade
14 questions
Boundaries & Healthy Relationships
Lesson
•
6th - 8th Grade
20 questions
Equivalent Fractions
Quiz
•
3rd Grade
3 questions
Integrity and Your Health
Lesson
•
6th - 8th Grade
25 questions
Multiplication Facts
Quiz
•
5th Grade
9 questions
FOREST Perception
Lesson
•
KG
20 questions
Main Idea and Details
Quiz
•
5th Grade
Discover more resources for Mathematics
20 questions
Scatter Plots and Line of Best Fit
Quiz
•
8th Grade
12 questions
8th U6 L4 - Fitting a Line to Data
Quiz
•
8th Grade
14 questions
Volume of rectangular prisms
Quiz
•
7th Grade
25 questions
Scatter Plots and Line of Best Fit
Quiz
•
8th Grade
14 questions
finding slope from a graph
Quiz
•
8th Grade
20 questions
Graphing Inequalities on a Number Line
Quiz
•
6th - 9th Grade
18 questions
Identifying Radius/Diameter
Quiz
•
7th Grade
20 questions
Pythagorean Theorem Review
Quiz
•
8th Grade