Understanding Z Scores and TI-84 Functions
Interactive Video
•
Mathematics, Computers
•
9th - 12th Grade
•
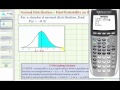
Practice Problem
•
Hard

Liam Anderson
FREE Resource
Read more
10 questions
Show all answers
1.
MULTIPLE CHOICE QUESTION
30 sec • 1 pt
What is the primary function of the TI-84 calculator discussed in this tutorial?
To calculate the mean of a data set
To find the probability of a Z score in a standard normal distribution
To solve linear equations
To graph polynomial functions
2.
MULTIPLE CHOICE QUESTION
30 sec • 1 pt
In the context of this tutorial, what does the area under the curve represent?
The median of the distribution
The probability that Z is greater than a given value
The standard deviation
The mean of the distribution
3.
MULTIPLE CHOICE QUESTION
30 sec • 1 pt
Which feature of the TI-84 calculator is used to find the probability of a Z score?
Statistical plot feature
Matrix feature
Normal CDF feature
Graphing feature
4.
MULTIPLE CHOICE QUESTION
30 sec • 1 pt
What values are set for mu and sigma when using the normal CDF feature for a standard normal distribution?
Mu = 1, Sigma = 0
Mu = 1, Sigma = 1
Mu = 0, Sigma = 0
Mu = 0, Sigma = 1
5.
MULTIPLE CHOICE QUESTION
30 sec • 1 pt
What is the lower bound Z score used in this tutorial?
0.5
-0.5
1.0
-1.0
6.
MULTIPLE CHOICE QUESTION
30 sec • 1 pt
What is the suggested upper bound Z score for the calculation?
1,000
99,999
10
3
7.
MULTIPLE CHOICE QUESTION
30 sec • 1 pt
What is the significance of setting the upper bound Z score to a large number like 99,999?
It ensures the calculation covers the entire right tail of the distribution
It limits the calculation to a small range
It is used to calculate the mean
It is a default setting in the calculator
Access all questions and much more by creating a free account
Create resources
Host any resource
Get auto-graded reports
Continue with Google

Continue with Email
Continue with Classlink
Continue with Clever
or continue with
Microsoft
%20(1).png)
Apple
Others
Already have an account?
