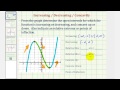
Understanding Graphs: Intervals, Extrema, and Concavity
Interactive Video
•
Mathematics
•
9th - 12th Grade
•
Practice Problem
•
Hard

Liam Anderson
FREE Resource
Read more
10 questions
Show all answers
1.
MULTIPLE CHOICE QUESTION
30 sec • 1 pt
What is the primary focus of the initial section of the video?
Determining the function's domain
Identifying open intervals for increasing or decreasing functions
Finding the function's zeros
Calculating the function's range
2.
MULTIPLE CHOICE QUESTION
30 sec • 1 pt
How can you tell if a function is increasing on a graph?
The graph moves upward from left to right
The graph moves downward from left to right
The graph remains constant
The graph forms a horizontal line
3.
MULTIPLE CHOICE QUESTION
30 sec • 1 pt
At which point does the function change from increasing to decreasing?
X = 0
X = 2
X = -2
X = 3
4.
MULTIPLE CHOICE QUESTION
30 sec • 1 pt
What is a relative maximum in the context of a graph?
The highest point on the entire graph
The lowest point on the entire graph
A point where the function changes from decreasing to increasing
A point where the function changes from increasing to decreasing
5.
MULTIPLE CHOICE QUESTION
30 sec • 1 pt
What is the relative minimum value mentioned in the video?
2.3 at X = 2
3.0 at X = 1
5.0 at X = 0
8.3 at X = -2
6.
MULTIPLE CHOICE QUESTION
30 sec • 1 pt
How is concavity determined on a graph?
By the intercepts of the graph
By the curvature of the graph
By the direction of the graph
By the slope of the tangent line
7.
MULTIPLE CHOICE QUESTION
30 sec • 1 pt
Where does the function change concavity according to the video?
At X = 2
At X = -2
At X = 0
At X = 3
Access all questions and much more by creating a free account
Create resources
Host any resource
Get auto-graded reports
Continue with Google

Continue with Email
Continue with Classlink
Continue with Clever
or continue with
Microsoft
%20(1).png)
Apple
Others
Already have an account?
