Understanding Limits from Graphs
Interactive Video
•
Mathematics
•
9th - 12th Grade
•
Practice Problem
•
Easy
Standards-aligned

Liam Anderson
Used 1+ times
FREE Resource
Standards-aligned
Read more
5 questions
Show all answers
1.
MULTIPLE CHOICE QUESTION
30 sec • 1 pt
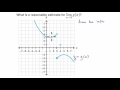
What is the main goal when estimating the limit of g(x) as x approaches 3?
To estimate the value g(x) approaches as x nears 3
To calculate the derivative of g(x) at x = 3
To determine if g(x) is continuous at x = 3
To find the exact value of g(x) at x = 3
Tags
CCSS.HSF-IF.C.7E
2.
MULTIPLE CHOICE QUESTION
30 sec • 1 pt
When approaching x = 3 from the left, what value does g(x) seem to approach?
0
-3
2
4
Tags
CCSS.HSF-IF.C.7E
3.
MULTIPLE CHOICE QUESTION
30 sec • 1 pt
What is the observed behavior of g(x) as x approaches 3 from the right?
g(x) approaches 4
g(x) remains constant
g(x) approaches 0
g(x) approaches -3
4.
MULTIPLE CHOICE QUESTION
30 sec • 1 pt
What conclusion can be drawn if the left and right limits are different?
The limit is the larger of the two values
The limit exists and is the average of the two values
The limit is the smaller of the two values
The limit does not exist
5.
MULTIPLE CHOICE QUESTION
30 sec • 1 pt
What is a key indicator that a limit might not exist at a certain point?
The graph is a curve
There is a jump or discontinuity in the graph
The graph is continuous
The graph is a straight line
Access all questions and much more by creating a free account
Create resources
Host any resource
Get auto-graded reports
Continue with Google

Continue with Email
Continue with Classlink
Continue with Clever
or continue with
Microsoft
%20(1).png)
Apple
Others
Already have an account?
