Khan Academy Growth Study Insights
Interactive Video
•
Mathematics, Education, Instructional Technology
•
6th - 12th Grade
•
Practice Problem
•
Hard
Standards-aligned

Mia Campbell
FREE Resource
Standards-aligned
Read more
10 questions
Show all answers
1.
MULTIPLE CHOICE QUESTION
30 sec • 1 pt
What was the primary goal of the study conducted by Khan Academy in Idaho?
To increase the number of users
To determine if the tool drives real learning
To develop new educational content
To expand to other states
2.
MULTIPLE CHOICE QUESTION
30 sec • 1 pt
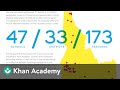
How many schools participated in the Khan Academy study in Idaho?
33 schools
173 schools
47 schools
200 schools
3.
MULTIPLE CHOICE QUESTION
30 sec • 1 pt
What exam was used to measure student growth in the study?
NWEA MAP exam
SAT
State standardized test
ACT
4.
MULTIPLE CHOICE QUESTION
30 sec • 1 pt
What does a positive correlation between mission completion and performance indicate?
Students are not learning effectively
There is no relationship between completion and performance
Students who complete more missions perform better
Students are spending too much time on missions
Tags
CCSS.HSF-LE.A.1B
5.
MULTIPLE CHOICE QUESTION
30 sec • 1 pt
What was the growth rate for students who completed 40% or more of their mission?
1.0 times expected growth
0.5 times expected growth
1.5 times expected growth
2.0 times expected growth
Tags
CCSS.HSF-BF.B.4A
6.
MULTIPLE CHOICE QUESTION
30 sec • 1 pt
How much growth did students achieve on average when completing 60% or more of their mission?
1.8 times expected growth
2.5 times expected growth
1.0 times expected growth
1.5 times expected growth
Tags
CCSS.HSF.IF.B.4
7.
MULTIPLE CHOICE QUESTION
30 sec • 1 pt
What does the vertical axis represent in the growth data analysis?
Number of missions completed
Average actual growth divided by target growth
Total number of students
Time spent on Khan Academy
Access all questions and much more by creating a free account
Create resources
Host any resource
Get auto-graded reports
Continue with Google

Continue with Email
Continue with Classlink
Continue with Clever
or continue with
Microsoft
%20(1).png)
Apple
Others
Already have an account?
