Understanding Quartiles and Interquartile Range
Interactive Video
•
Mathematics, Science
•
6th - 10th Grade
•
Practice Problem
•
Medium
Standards-aligned

Jackson Turner
Used 5+ times
FREE Resource
Standards-aligned
Read more
10 questions
Show all answers
1.
MULTIPLE CHOICE QUESTION
30 sec • 1 pt
What is the purpose of calculating the interquartile range (IQR)?
To find the average of a dataset
To measure the spread of the middle 50% of a dataset
To identify the highest and lowest values in a dataset
To calculate the sum of all data points
Tags
CCSS.6.SP.B.5C
2.
MULTIPLE CHOICE QUESTION
30 sec • 1 pt
What is the first step in calculating quartiles?
Find the extremes
Calculate the IQR
Order the numbers from least to greatest
Identify the median
3.
MULTIPLE CHOICE QUESTION
30 sec • 1 pt
How do you identify the extremes in a dataset?
By finding the median
By identifying the smallest and largest numbers
By calculating the average
By subtracting the smallest number from the largest
Tags
CCSS.6.SP.B.5C
4.
MULTIPLE CHOICE QUESTION
30 sec • 1 pt
What is the median of a dataset with an even number of data points?
The middle number
The average of the two middle numbers
The smallest number
The largest number
Tags
CCSS.6.SP.B.5C
5.
MULTIPLE CHOICE QUESTION
30 sec • 1 pt
How is Q3, the upper quartile, determined?
By subtracting Q1 from the median
By finding the median of the entire dataset
By adding the smallest and largest numbers
By finding the median of the upper half of the dataset
Tags
CCSS.6.SP.B.5C
6.
MULTIPLE CHOICE QUESTION
30 sec • 1 pt
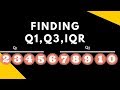
What is the value of Q3 in the example provided?
95
90
85
82
Tags
CCSS.6.SP.B.5C
7.
MULTIPLE CHOICE QUESTION
30 sec • 1 pt
How is Q1, the lower quartile, calculated?
By finding the average of all numbers
By subtracting Q3 from the median
By finding the median of the lower half of the dataset
By adding the smallest and largest numbers
Tags
CCSS.6.SP.B.5C
Access all questions and much more by creating a free account
Create resources
Host any resource
Get auto-graded reports
Continue with Google

Continue with Email
Continue with Classlink
Continue with Clever
or continue with
Microsoft
%20(1).png)
Apple
Others
Already have an account?
Popular Resources on Wayground

15 questions
Fractions on a Number Line
Quiz
•
3rd Grade
20 questions
Equivalent Fractions
Quiz
•
3rd Grade
25 questions
Multiplication Facts
Quiz
•
5th Grade
22 questions
fractions
Quiz
•
3rd Grade
20 questions
Main Idea and Details
Quiz
•
5th Grade
20 questions
Context Clues
Quiz
•
6th Grade
15 questions
Equivalent Fractions
Quiz
•
4th Grade
20 questions
Figurative Language Review
Quiz
•
6th Grade
Discover more resources for Mathematics
20 questions
Exponents
Quiz
•
6th Grade
22 questions
distributive property
Quiz
•
7th Grade
15 questions
Distributive Property & Review
Quiz
•
6th Grade
20 questions
Writing Algebraic Expressions
Quiz
•
6th Grade
20 questions
Ratios/Rates and Unit Rates
Quiz
•
6th Grade
20 questions
Writing and Graphing Inequalities
Quiz
•
6th Grade
15 questions
Product of Powers Property A1 U7
Quiz
•
8th Grade
20 questions
Laws of Exponents
Quiz
•
8th Grade