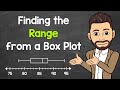
Understanding Range in Box Plots
Interactive Video
•
Mathematics
•
5th - 8th Grade
•
Practice Problem
•
Medium
Standards-aligned

Aiden Montgomery
Used 2+ times
FREE Resource
Standards-aligned
Read more
8 questions
Show all answers
1.
MULTIPLE CHOICE QUESTION
30 sec • 1 pt
What is the main topic discussed in the video?
How to calculate the mean of a data set
How to find the range from box plots
How to draw a box plot
How to interpret pie charts
Tags
CCSS.6.SP.B.4
CCSS.HSS.ID.A.1
2.
MULTIPLE CHOICE QUESTION
30 sec • 1 pt
Which two values are essential for finding the range in a box plot?
Median and mode
Maximum and minimum
First quartile and third quartile
Mean and median
Tags
CCSS.6.SP.B.4
CCSS.HSS.ID.A.1
3.
MULTIPLE CHOICE QUESTION
30 sec • 1 pt
What does the range of a data set represent?
The most frequently occurring value
The spread between the highest and lowest values
The sum of all data points
The average of all data points
Tags
CCSS.6.SP.B.4
CCSS.HSS.ID.A.1
4.
MULTIPLE CHOICE QUESTION
30 sec • 1 pt
In the example provided, what is the maximum value?
100
16
94
78
Tags
CCSS.6.SP.B.4
CCSS.HSS.ID.A.1
5.
MULTIPLE CHOICE QUESTION
30 sec • 1 pt
In the example provided, what is the minimum value?
78
94
16
100
Tags
CCSS.6.SP.B.4
CCSS.HSS.ID.A.1
6.
MULTIPLE CHOICE QUESTION
30 sec • 1 pt
What is the calculated range in the example?
22
94
16
78
Tags
CCSS.6.SP.B.4
CCSS.HSS.ID.A.1
7.
MULTIPLE CHOICE QUESTION
30 sec • 1 pt
What is the purpose of the video according to the conclusion?
To explain the history of box plots
To provide a detailed explanation of box plots
To focus on finding the range from box plots
To teach how to draw box plots
Tags
CCSS.6.SP.B.4
CCSS.HSS.ID.A.1
Access all questions and much more by creating a free account
Create resources
Host any resource
Get auto-graded reports
Continue with Google

Continue with Email
Continue with Classlink
Continue with Clever
or continue with
Microsoft
%20(1).png)
Apple
Others
Already have an account?
Similar Resources on Wayground
Popular Resources on Wayground

8 questions
Spartan Way - Classroom Responsible
Quiz
•
9th - 12th Grade
15 questions
Fractions on a Number Line
Quiz
•
3rd Grade
14 questions
Boundaries & Healthy Relationships
Lesson
•
6th - 8th Grade
20 questions
Equivalent Fractions
Quiz
•
3rd Grade
3 questions
Integrity and Your Health
Lesson
•
6th - 8th Grade
25 questions
Multiplication Facts
Quiz
•
5th Grade
9 questions
FOREST Perception
Lesson
•
KG
20 questions
Main Idea and Details
Quiz
•
5th Grade
Discover more resources for Mathematics
25 questions
Multiplication Facts
Quiz
•
5th Grade
22 questions
Adding & Subtracting fractions with like denominators
Quiz
•
3rd - 5th Grade
12 questions
Review: Surface Area of Rectangular and Triangular Prisms
Quiz
•
6th Grade
20 questions
Scatter Plots and Line of Best Fit
Quiz
•
8th Grade
36 questions
6th Grade Math STAAR Review
Quiz
•
6th Grade
15 questions
Rounding Decimals
Quiz
•
5th Grade
12 questions
8th U6 L4 - Fitting a Line to Data
Quiz
•
8th Grade
14 questions
Volume of rectangular prisms
Quiz
•
7th Grade