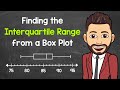
Understanding Interquartile Range from Box Plots
Interactive Video
•
Mathematics
•
6th - 8th Grade
•
Practice Problem
•
Medium
Standards-aligned

Aiden Montgomery
Used 12+ times
FREE Resource
Standards-aligned
Read more
9 questions
Show all answers
1.
MULTIPLE CHOICE QUESTION
30 sec • 1 pt
What is the main topic covered in the video?
Finding the interquartile range from box plots
Calculating mean from data sets
Understanding standard deviation
Learning about probability
Tags
CCSS.6.SP.B.5C
2.
MULTIPLE CHOICE QUESTION
30 sec • 1 pt
Which parts of the box plot are essential for calculating the interquartile range?
Outliers and median
Median and mean
First quartile and third quartile
Minimum and maximum
Tags
CCSS.6.SP.B.5C
3.
MULTIPLE CHOICE QUESTION
30 sec • 1 pt
What does the interquartile range represent?
The difference between the highest and lowest values
The spread of the middle 50% of the data
The average of all data points
The spread of the entire data set
Tags
CCSS.6.SP.B.5C
4.
MULTIPLE CHOICE QUESTION
30 sec • 1 pt
In the example, what is the value of the third quartile?
84
90
50
6
Tags
CCSS.6.SP.B.5C
5.
MULTIPLE CHOICE QUESTION
30 sec • 1 pt
What is the calculated interquartile range in the example?
50
6
90
84
Tags
CCSS.6.SP.B.5C
6.
MULTIPLE CHOICE QUESTION
30 sec • 1 pt
Why is the interquartile range important?
It shows the average score
It determines the mode of the data
It indicates the spread of the middle 50% of data
It highlights the highest score
Tags
CCSS.6.SP.B.5C
7.
MULTIPLE CHOICE QUESTION
30 sec • 1 pt
What percentage of data does the interquartile range cover?
100%
25%
50%
75%
Tags
CCSS.6.SP.B.5C
Access all questions and much more by creating a free account
Create resources
Host any resource
Get auto-graded reports
Continue with Google

Continue with Email
Continue with Classlink
Continue with Clever
or continue with
Microsoft
%20(1).png)
Apple
Others
Already have an account?
Popular Resources on Wayground

15 questions
Fractions on a Number Line
Quiz
•
3rd Grade
20 questions
Equivalent Fractions
Quiz
•
3rd Grade
25 questions
Multiplication Facts
Quiz
•
5th Grade
22 questions
fractions
Quiz
•
3rd Grade
20 questions
Main Idea and Details
Quiz
•
5th Grade
20 questions
Context Clues
Quiz
•
6th Grade
15 questions
Equivalent Fractions
Quiz
•
4th Grade
20 questions
Figurative Language Review
Quiz
•
6th Grade
Discover more resources for Mathematics
20 questions
Exponents
Quiz
•
6th Grade
22 questions
distributive property
Quiz
•
7th Grade
15 questions
Distributive Property & Review
Quiz
•
6th Grade
20 questions
Writing Algebraic Expressions
Quiz
•
6th Grade
20 questions
Ratios/Rates and Unit Rates
Quiz
•
6th Grade
20 questions
Writing and Graphing Inequalities
Quiz
•
6th Grade
15 questions
Product of Powers Property A1 U7
Quiz
•
8th Grade
20 questions
Laws of Exponents
Quiz
•
8th Grade