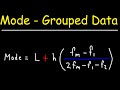
Understanding the Mode of Grouped Data
Interactive Video
•
Mathematics, Science
•
7th - 10th Grade
•
Practice Problem
•
Hard

Ethan Morris
FREE Resource
Read more
10 questions
Show all answers
1.
MULTIPLE CHOICE QUESTION
30 sec • 1 pt
What is the primary focus of this lesson?
Calculating the median of grouped data
Calculating the mean of grouped data
Calculating the range of grouped data
Calculating the mode of grouped data
2.
MULTIPLE CHOICE QUESTION
30 sec • 1 pt
Which column in the data table represents the number of students with specific grades?
Third column
First column
Fourth column
Second column
3.
MULTIPLE CHOICE QUESTION
30 sec • 1 pt
What does 'L' represent in the mode calculation formula?
Upper boundary of the modal class
Lower boundary of the modal class
Size of the modal class
Frequency of the modal class
4.
MULTIPLE CHOICE QUESTION
30 sec • 1 pt
How is the size of the class interval (H) determined?
By subtracting the lower boundary from the upper boundary
By dividing the frequency of the class by two
By adding the lower and upper boundaries
By finding the midpoint of the class boundaries
5.
MULTIPLE CHOICE QUESTION
30 sec • 1 pt
What is the frequency of the modal class in this example?
6
8
10
9
6.
MULTIPLE CHOICE QUESTION
30 sec • 1 pt
What mistake was corrected during the calculation of the mode?
The frequency of the succeeding class was wrong
The value of H was initially incorrect
The cumulative frequency was miscalculated
The value of L was incorrect
7.
MULTIPLE CHOICE QUESTION
30 sec • 1 pt
What is the final calculated mode of the grouped data?
79.5
77
70
69.5
Access all questions and much more by creating a free account
Create resources
Host any resource
Get auto-graded reports
Continue with Google

Continue with Email
Continue with Classlink
Continue with Clever
or continue with
Microsoft
%20(1).png)
Apple
Others
Already have an account?
