Understanding Data Distributions and Measures
Interactive Video
•
Mathematics
•
9th - 10th Grade
•
Practice Problem
•
Hard

Thomas White
FREE Resource
Read more
8 questions
Show all answers
1.
MULTIPLE CHOICE QUESTION
30 sec • 1 pt
What is the mode in a data set?
The sum of all data points
The most frequently occurring value
The middle value when data is ordered
The average of all data points
2.
MULTIPLE CHOICE QUESTION
30 sec • 1 pt
How does a histogram help in understanding data?
It lists data points in ascending order
It shows the exact values of data points
It calculates the mean of the data
It displays the frequency distribution of data
3.
MULTIPLE CHOICE QUESTION
30 sec • 1 pt
Why are bin sizes important in histograms?
They determine the number of data points
They affect the shape and interpretation of the histogram
They are used to find the median
They calculate the mode of the data
4.
MULTIPLE CHOICE QUESTION
30 sec • 1 pt
What is the difference between individual data points and grouped data in bins?
Grouped data in bins is less informative
Grouped data in bins provides a clearer picture of data distribution
Individual data points are more accurate
Individual data points are always larger
5.
MULTIPLE CHOICE QUESTION
30 sec • 1 pt
Where is the mean located on a histogram?
At the lowest point
At the center of the data
At the end of the histogram
At the highest peak
6.
MULTIPLE CHOICE QUESTION
30 sec • 1 pt
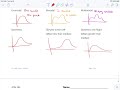
What happens to the mean, median, and mode in a symmetric data distribution?
The mode is less than the mean
They are all different
They are all equal
The mean is greater than the median
7.
MULTIPLE CHOICE QUESTION
30 sec • 1 pt
In a skewed left distribution, how does the mean compare to the median?
The mean is greater than the median
The mean is less than the median
The mean is equal to the median
The mean is not affected by skewness
Access all questions and much more by creating a free account
Create resources
Host any resource
Get auto-graded reports
Continue with Google

Continue with Email
Continue with Microsoft
or continue with

%20(1).png)
Apple
Others
Already have an account?
