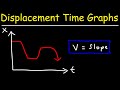
Understanding Velocity from Position-Time Graphs
Interactive Video
•
Physics, Mathematics, Science
•
9th - 12th Grade
•
Practice Problem
•
Hard

Emma Peterson
FREE Resource
Read more
10 questions
Show all answers
1.
MULTIPLE CHOICE QUESTION
30 sec • 1 pt
What is the primary method to find velocity from a position-time graph?
By measuring the area under the curve
By taking the derivative of the position function
By calculating the average of all points
By counting the number of peaks
2.
MULTIPLE CHOICE QUESTION
30 sec • 1 pt
If the position function is constant, what is the velocity?
Negative
Zero
Undefined
Positive
3.
MULTIPLE CHOICE QUESTION
30 sec • 1 pt
How do you calculate the slope between two points on a position-time graph?
By dividing the change in time by the change in position
By dividing the change in position by the change in time
By adding the change in position and change in time
By multiplying the change in position by the change in time
4.
MULTIPLE CHOICE QUESTION
30 sec • 1 pt
What is the velocity between T=5 and T=10 seconds if the position changes from 25 meters to 10 meters?
-3 meters per second
5 meters per second
-5 meters per second
3 meters per second
5.
MULTIPLE CHOICE QUESTION
30 sec • 1 pt
What is the velocity during a segment where the position changes from 10 meters to 20 meters over 5 seconds?
1 meter per second
4 meters per second
2 meters per second
3 meters per second
6.
MULTIPLE CHOICE QUESTION
30 sec • 1 pt
What happens to velocity when the position function is decreasing?
Velocity becomes positive
Velocity becomes zero
Velocity becomes negative
Velocity becomes constant
7.
MULTIPLE CHOICE QUESTION
30 sec • 1 pt
What does a concave down shape on a position-time graph indicate about acceleration?
Acceleration is zero
Acceleration is positive
Acceleration is negative
Acceleration is constant
Access all questions and much more by creating a free account
Create resources
Host any resource
Get auto-graded reports
Continue with Google

Continue with Email
Continue with Classlink
Continue with Clever
or continue with
Microsoft
%20(1).png)
Apple
Others
Already have an account?
Popular Resources on Wayground

8 questions
Spartan Way - Classroom Responsible
Quiz
•
9th - 12th Grade
15 questions
Fractions on a Number Line
Quiz
•
3rd Grade
14 questions
Boundaries & Healthy Relationships
Lesson
•
6th - 8th Grade
20 questions
Equivalent Fractions
Quiz
•
3rd Grade
3 questions
Integrity and Your Health
Lesson
•
6th - 8th Grade
25 questions
Multiplication Facts
Quiz
•
5th Grade
9 questions
FOREST Perception
Lesson
•
KG
20 questions
Main Idea and Details
Quiz
•
5th Grade
Discover more resources for Physics
10 questions
Exit Check 4.5 - Impulse
Quiz
•
9th Grade
20 questions
Simple Machines and Mechanical Advantage Quiz
Quiz
•
9th Grade
20 questions
Electricity/Magnets
Quiz
•
9th Grade
20 questions
Light Vs. Sound Waves
Quiz
•
9th - 12th Grade
14 questions
Bill Nye Waves
Interactive video
•
9th - 12th Grade
37 questions
CIA #3 Study Guide: ACPS
Quiz
•
10th Grade
20 questions
Waves
Quiz
•
9th - 12th Grade
10 questions
Exploring the Properties of Waves
Interactive video
•
9th - 12th Grade