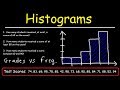
Understanding Histograms and Frequency Distribution
Interactive Video
•
Mathematics, Science, Education
•
6th - 10th Grade
•
Practice Problem
•
Medium
+1
Standards-aligned

Amelia Wright
Used 25+ times
FREE Resource
Standards-aligned
Read more
10 questions
Show all answers
1.
MULTIPLE CHOICE QUESTION
30 sec • 1 pt
What is the first step in creating a histogram from data?
Calculate the mean of the data
Create a frequency distribution table
Draw a pie chart
List all data points
Tags
CCSS.6.SP.B.4
CCSS.HSS.ID.A.1
2.
MULTIPLE CHOICE QUESTION
30 sec • 1 pt
How are test scores grouped in a frequency distribution table?
In ranges of 10
Individually
In ranges of 5
In ranges of 20
Tags
CCSS.HSN.Q.A.1
3.
MULTIPLE CHOICE QUESTION
30 sec • 1 pt
What is the class width used for grouping test scores?
15
10
20
5
Tags
CCSS.6.SP.B.4
CCSS.HSS.ID.A.1
4.
MULTIPLE CHOICE QUESTION
30 sec • 1 pt
What distinguishes a histogram from a bar graph?
Histograms have spaces between bars
Histograms are circular
Histograms have attached bars
Histograms use different colors
Tags
CCSS.6.SP.B.4
CCSS.HSS.ID.A.1
5.
MULTIPLE CHOICE QUESTION
30 sec • 1 pt
On which axis are the frequencies plotted in a histogram?
None
Z-axis
Y-axis
X-axis
6.
MULTIPLE CHOICE QUESTION
30 sec • 1 pt
What does a long tail on the left side of a histogram indicate?
Data is skewed to the right
Data is uniform
Data is skewed to the left
Data is symmetric
Tags
CCSS.6.SP.B.4
CCSS.HSS.ID.A.1
7.
MULTIPLE CHOICE QUESTION
30 sec • 1 pt
Which range represents the mode in the given histogram?
90-100
80-89
60-69
40-49
Tags
CCSS.6.EE.B.8
Access all questions and much more by creating a free account
Create resources
Host any resource
Get auto-graded reports
Continue with Google

Continue with Email
Continue with Classlink
Continue with Clever
or continue with
Microsoft
%20(1).png)
Apple
Others
Already have an account?
