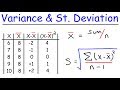
Understanding Variance and Standard Deviation
Interactive Video
•
Mathematics, Science
•
7th - 12th Grade
•
Practice Problem
•
Hard
Standards-aligned

Sophia Harris
Used 1+ times
FREE Resource
Standards-aligned
Read more
10 questions
Show all answers
1.
MULTIPLE CHOICE QUESTION
30 sec • 1 pt
What do variance and standard deviation measure in a data set?
The average value of the data set
The highest value in the data set
The spread of the data from the center
The total sum of the data values
2.
MULTIPLE CHOICE QUESTION
30 sec • 1 pt
What is the symbol used to denote sample variance?
s squared
s
x bar
n
Tags
CCSS.6.SP.B.5C
3.
MULTIPLE CHOICE QUESTION
30 sec • 1 pt
How do you calculate the mean of a list of numbers?
Add all numbers and divide by two
Multiply all numbers together
Subtract the smallest number from the largest
Add all numbers and divide by the number of values
4.
MULTIPLE CHOICE QUESTION
30 sec • 1 pt
What is the next step after calculating the deviations from the mean?
Divide the deviations by the number of values
Multiply the deviations by the mean
Square the deviations
Add the deviations
5.
MULTIPLE CHOICE QUESTION
30 sec • 1 pt
What is the variance of the second list of numbers (4, 6, 8, 10, 12)?
2.5
10
5
15
6.
MULTIPLE CHOICE QUESTION
30 sec • 1 pt
How is the standard deviation related to the variance?
It is the square of the variance
It is the square root of the variance
It is half the variance
It is twice the variance
Tags
CCSS.6.SP.B.5C
7.
MULTIPLE CHOICE QUESTION
30 sec • 1 pt
In the advanced example, what additional column is added to the table?
Median
Sum of deviations
Frequency
Cumulative frequency
Tags
CCSS.6.SP.B.5C
Access all questions and much more by creating a free account
Create resources
Host any resource
Get auto-graded reports
Continue with Google

Continue with Email
Continue with Classlink
Continue with Clever
or continue with
Microsoft
%20(1).png)
Apple
Others
Already have an account?
Popular Resources on Wayground

7 questions
History of Valentine's Day
Interactive video
•
4th Grade
15 questions
Fractions on a Number Line
Quiz
•
3rd Grade
20 questions
Equivalent Fractions
Quiz
•
3rd Grade
25 questions
Multiplication Facts
Quiz
•
5th Grade
22 questions
fractions
Quiz
•
3rd Grade
15 questions
Valentine's Day Trivia
Quiz
•
3rd Grade
20 questions
Main Idea and Details
Quiz
•
5th Grade
20 questions
Context Clues
Quiz
•
6th Grade
Discover more resources for Mathematics
14 questions
Volume of rectangular prisms
Quiz
•
7th Grade
20 questions
Laws of Exponents
Quiz
•
8th Grade
20 questions
Graphing Inequalities on a Number Line
Quiz
•
6th - 9th Grade
20 questions
Exponent Properties
Quiz
•
9th Grade
16 questions
2022 Winter Olympics Medal Table
Passage
•
6th - 8th Grade
20 questions
Complementary Supplementary Vertical Adjacent Angles
Quiz
•
8th Grade
12 questions
Add, Subtract, Multiply and divide integers
Quiz
•
7th Grade
20 questions
One Step equations addition and subtraction
Quiz
•
5th - 8th Grade