Understanding Measures of Dispersion
Interactive Video
•
Mathematics
•
9th - 10th Grade
•
Practice Problem
•
Hard

Jennifer Brown
FREE Resource
10 questions
Show all answers
1.
MULTIPLE CHOICE QUESTION
30 sec • 1 pt
What is the first step in determining if data vary?
Finding the mode
Summarizing the data
Calculating the median
Calculating the Z-score
2.
MULTIPLE CHOICE QUESTION
30 sec • 1 pt
In the Rotten Tomatoes example, what is the range of scores?
0 to 100
60 to 100
80 to 100
59 to 100
3.
MULTIPLE CHOICE QUESTION
30 sec • 1 pt
Which measure of dispersion is calculated on the way to finding the Standard Deviation?
Range
Variance
Mean
Z-score
4.
MULTIPLE CHOICE QUESTION
30 sec • 1 pt
What does a Variance of 0 indicate about a dataset?
All scores are different
All scores are the same
Scores are widely spread
Scores are normally distributed
5.
MULTIPLE CHOICE QUESTION
30 sec • 1 pt
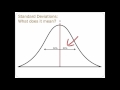
In a normal distribution, what percentage of scores lie within one standard deviation of the mean?
95%
99%
50%
68%
6.
MULTIPLE CHOICE QUESTION
30 sec • 1 pt
If a dataset has a mean of 42 and a standard deviation of 12, what is the score at two standard deviations above the mean?
66
54
78
90
7.
MULTIPLE CHOICE QUESTION
30 sec • 1 pt
What does a higher Standard Deviation indicate about a dataset?
Scores are normally distributed
Scores are all the same
Scores are more spread out
Scores are closer to the mean
Access all questions and much more by creating a free account
Create resources
Host any resource
Get auto-graded reports
Continue with Google

Continue with Email
Continue with Classlink
Continue with Clever
or continue with
Microsoft
%20(1).png)
Apple
Others
Already have an account?
